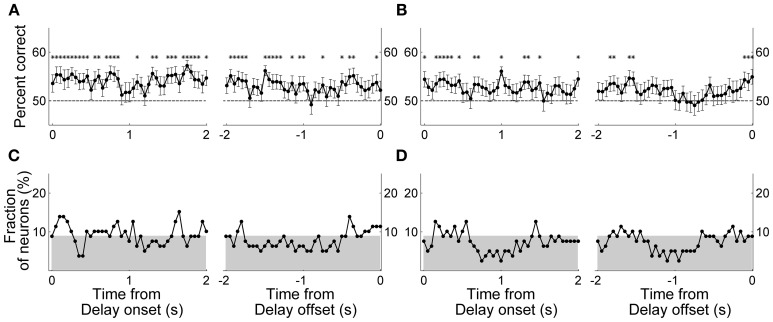
Figure 6.
Neural decoding of the animal's goal choice. The animal's trial-by-trial goal choices (A and C, previous goal choice; B and D, upcoming goal choice) were predicted using a discriminant analysis based on individual neuronal activity during a 1-s time window that was advanced in 50-ms steps. In each panel, the first data point of the left graph (time from delay onset) corresponds to the first 1 s of the delay period, and the last data point of the right graph (time from delay offset) corresponds to the last 1 s of the delay period. (A,B) Percentages of correct prediction averaged across all analyzed neurons (n = 80). Asterisks denote significant difference from chance level (50%; t-test, p < 0.05). The error bars are SEM. (C,D) Fractions of neurons with significant decoding of the animal's goal choice. The shading indicates chance level (binomial test, alpha = 0.05).

