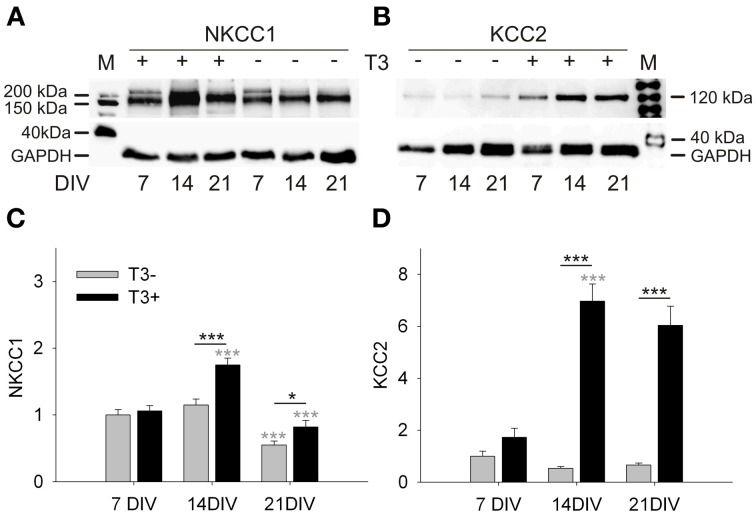
Figure 1.
Development of NKCC1 and KCC2 expression in T3+ (+) and T3− (−) networks. Representative Western blots of 7 to 21-day-old cultures stained for NKCC1 (A) or KCC2 (B). Expression of NKCC1 and KCC2 was increased in T3+ cultures compared with T3− cultures at 14 and 21 DIV. NKCC1 protein expression increased between 7 and 14 DIV, but decreases again until 21 DIV (A,C). KCC2 protein expression did not change in function of age in T3− cultures. In contrast, KCC2 expression in T3+ cultures increased markedly during the second week in vitro (B,D). Black asterisks show statistical significant differences between T3+ and T3− networks; Gray asterisks show age-dependent differences. M, lane with molecular weight marker proteins. GAPDH protein level was used as a loading control. Values in graphs (C,D) were normalized to the T3− value at 7 DIV.

