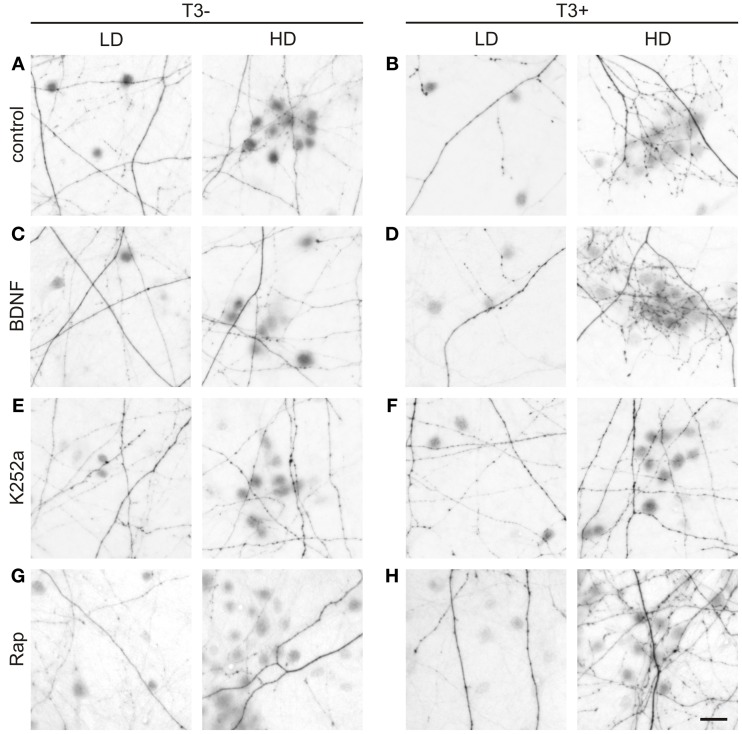
Figure 11.
T3-dependent distribution of L-GABA axons and boutons and the effect of trkB and mTOR signaling. Images show GABAergic innervation patterns of LD or HD areas in 14-day-old T3− (A) and T3+ control cultures (B), T3− and T3+ cultures treated with BDNF (C,D), T3− and T3+ cultures treated with K252a (E,F), and T3− and T3+ cultures treated with rapamycin (G,H). Scale bar = 20 μm.

