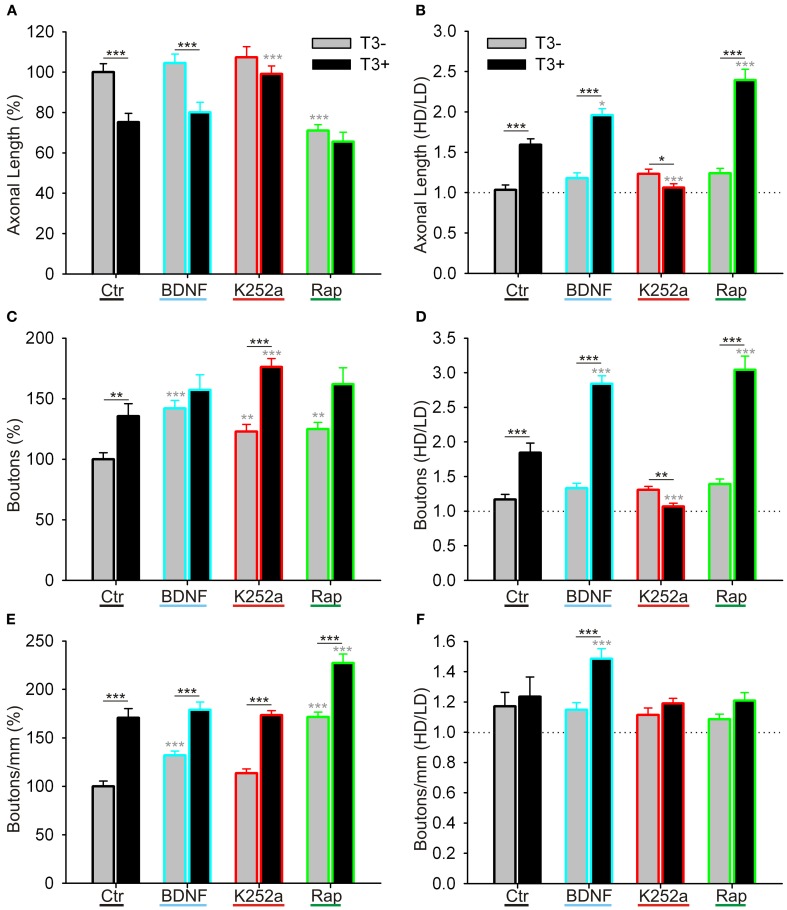
Figure 12.
Quantitative measurements of L-GABAergic axons and boutons. Graphs illustrate the effect of T3 (gray bars: T3−; black bars: T3+), of BDNF (blue contours), trkB blockade (red contours), and mTOR blockade (green contours) on GABAergic axonal length/field (A,B), bouton density/field (C,D), and bouton density/mm axon (E,F). (A,C,E) show means ± SEM of all fields, normalized to T3− control; (B,D,F) show the ratio of the data grouped by the local cell density (see text for details). LD, Low cell density fields; HD, High cell density fields; Ctr, Control networks; K252a, blocker of trkB signaling; Rap, rapamycin, blocker of mTOR signaling.

