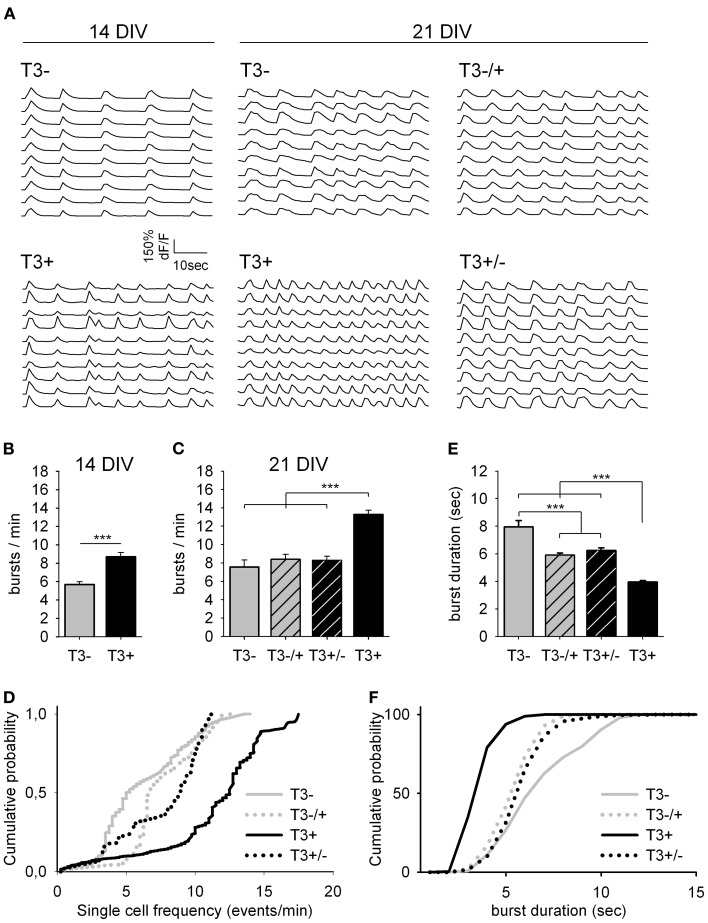
Figure 3.
Spontaneous network activity at 14 and 21 DIV. (A). Traces show the change in intracellular calcium signals of individual neurons from 14- or 21-day-old cultures grown either in the absence or presence of T3, as indicated. (B). T3 increases the burst frequency at 14 DIV. (C). The maximal burst frequency at 21 DIV was measured in cultures chronically treated with T3 (T3+). (D). Graphs show the cumulative probability for single cell frequency. (E,F). Burst duration at 21 DIV was reduced in T3+ cultures compared with T3− cultures and reversal experiments. The cumulative representation of burst durations (F) includes all single transients of mean dF/F data (see Table 1).

