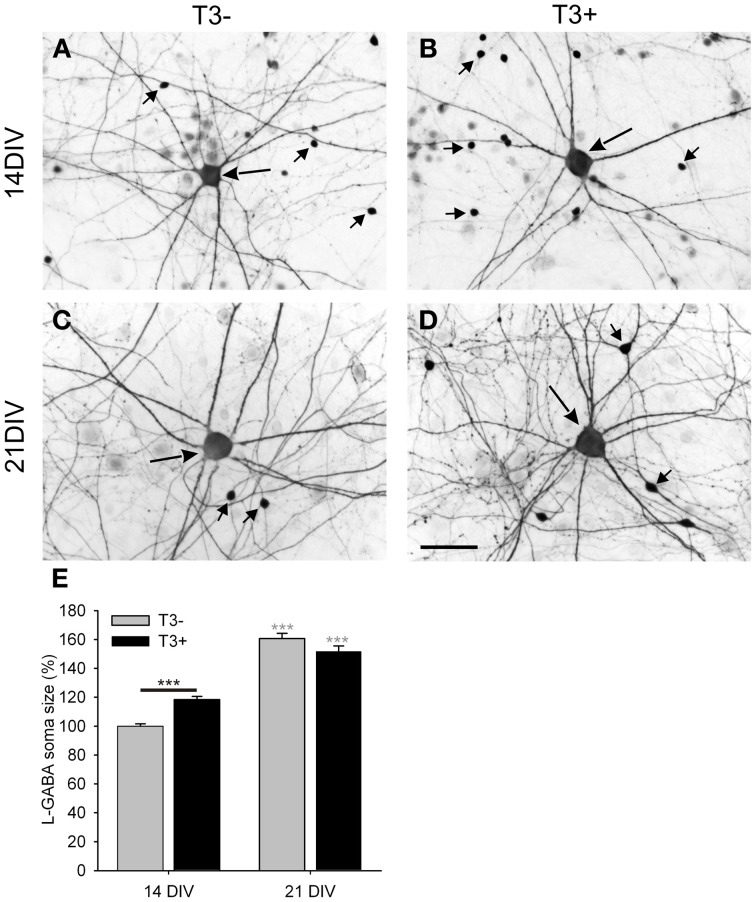
Figure 4.
Images show GABA immunostained 14- and 21-day-old cultures grown in the absence (A,C; T3−) or presence (B,D; T3+) of T3. All images show a central L-GABAergic neuron (L-GABA, large arrow) surrounded by smaller S-GABAergic neurons (S-GABA, small arrows) and unstained non-GABAergic neurons (non-GABA). At 14 DIV L-GABA are hypertrophic in the T3+ cultures compared with T3− cultures, but at 21 DIV L-GABA have similar soma size in T3− and T3+ cultures. An increased number of the smaller GABAergic neurons in T3+ cultures are observed at 14 and 21 DIV. (E). The soma size of L-GABA was not different among experimental sets at 21 DIV. Gray asterisks show the significance of the differences between 14- and 21-day-old cultures of the same treatment group. Scale bar in (A–D) = 50 μm.

