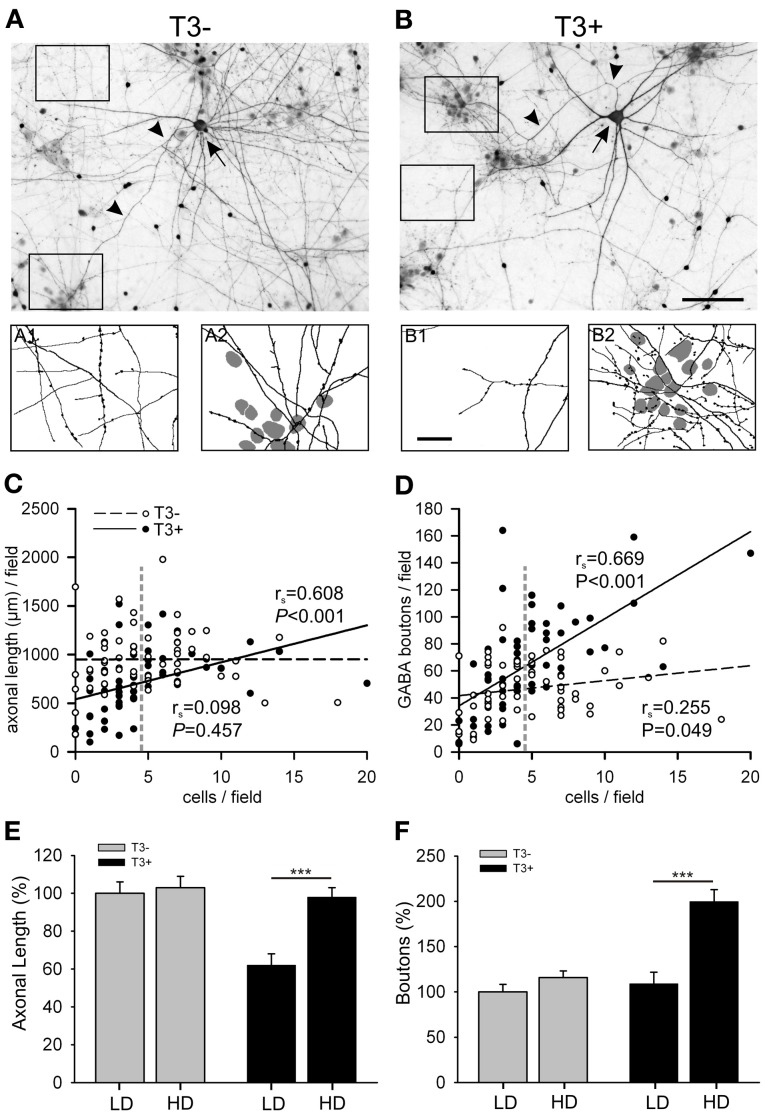
Figure 6.
(A,B) Images show GABA-immunostained 14-day-old cultures grown in the absence (A) or presence (B) of T3. Each image shows a L-GABAergic neuron (arrow) with its conspicuous axons (arrow heads) surrounded by smaller S-GABA neurons and unstained non-GABAergic neurons. In T3− cultures, both cell-poor (A1) and cell-rich (A2) regions are equally covered with L-GABAergic axons. In T3+ cultures, L-GABA axons selectively target groups of neuronal cell bodies (B2), but sparsely innervate cell-poor regions (B1). The scatter plots show that the axonal length (C) and the number of GABAergic boutons (D) are positively correlated with the local density of non-GABAergic neurons in T3+, but not in T3− cultures. Each dot represents one field (120 × 90 μm). Lines show best linear fit. P-values and rs coefficients are results of Spearman rank order correlation tests (SROC). Vertical dashed lines in (C,D) indicate the mean cell density of non-GABA neurons. This value was defined as the border between LD and HD fields (see text). (E,F) show means ± SEM of the data grouped according to the local cell density. LD, Low cell density fields; HD, High cell density fields; Scale bars: 100 μm in (A,B); 25 μm in A1,A2 and B1, B2.

