Figure 8.
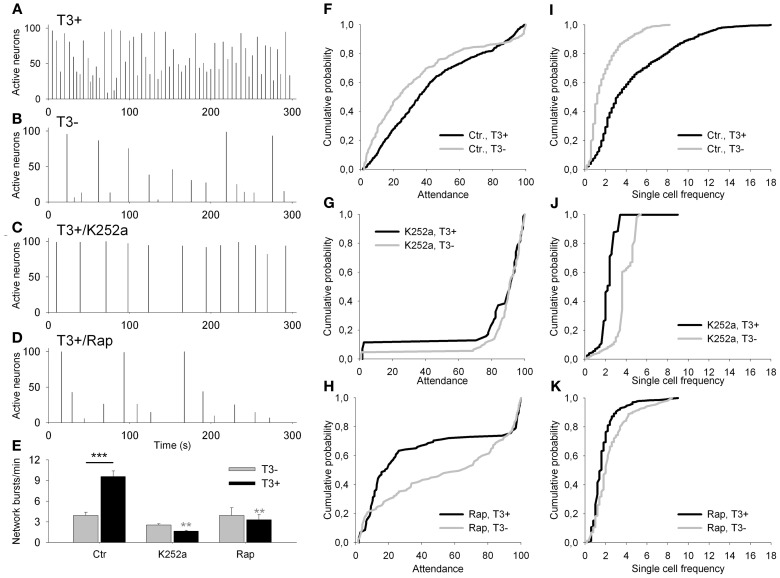
(A–D) Network activity histograms of representative fields recorded at 13–14 DIV with Fluo-4 calcium imaging. Bars show the percentage of active neurons against time. (E) The graph shows the network burst frequency for T3− (gray bars) and T3+ (black bars) in control sets of cultures (Ctr), and in cultures treated chronically with K252a or rapamycin (Rap). (F–K) Graphs show the cumulative probability for attendance (% of active cells participating in single activity events) (F–H) and single cell frequency (I–K) for each of control (F,I) and drug-treated culture sets (K252a: G,J; rapamycin: H,K).

