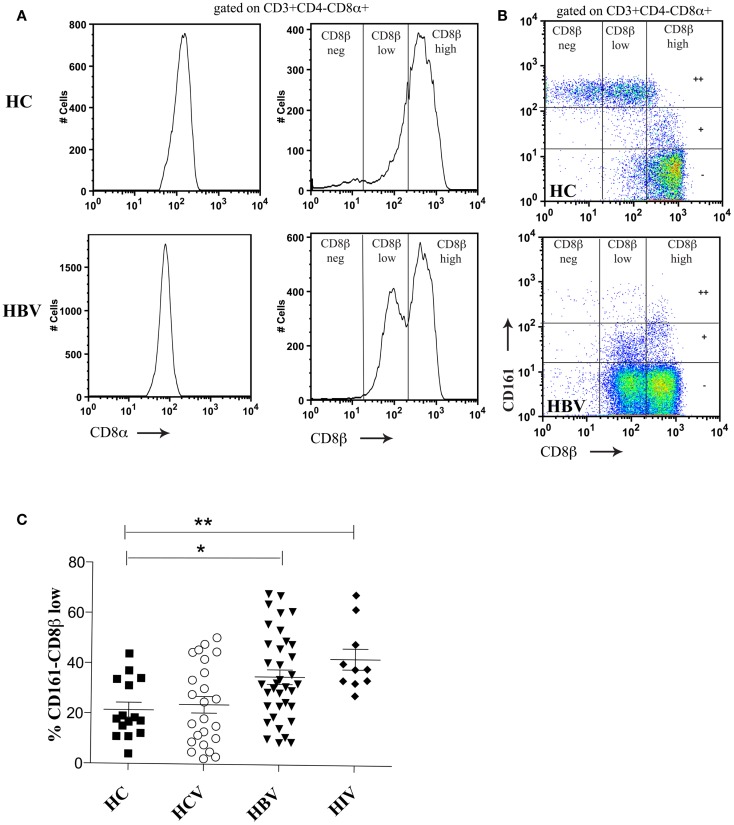
Figure 1.
Distinct CD8β expression levels are demonstrated on CD161++, CD161+, and CD161−CD8α+ T cell subsets. (A) Co-staining of PBMCs with anti-CD8α and anti-CD8β antibodies identifies a range of CD8β expression by CD3+CD4−CD8α+ T cells in both a HC and patient with HBV. (B) Distinct CD8βhigh, CD8βlow, and CD8βneg populations are demonstrated based on the level of CD161 expression (marked on the vertical gates on FACS plots as++/±). Representative FACS plots of both HC (n = 16) and patients with chronic HBV (n = 31) shown. (C) The size of the CD161−CD8α+ CD8βlow T cell population as a percentage of the CD161−CD8α+ population is compared between HCs and patients with chronic HBV, HCV, and HIV-1 infections. (*p < 0.05, **p < 0.001, One-way ANOVAs).

