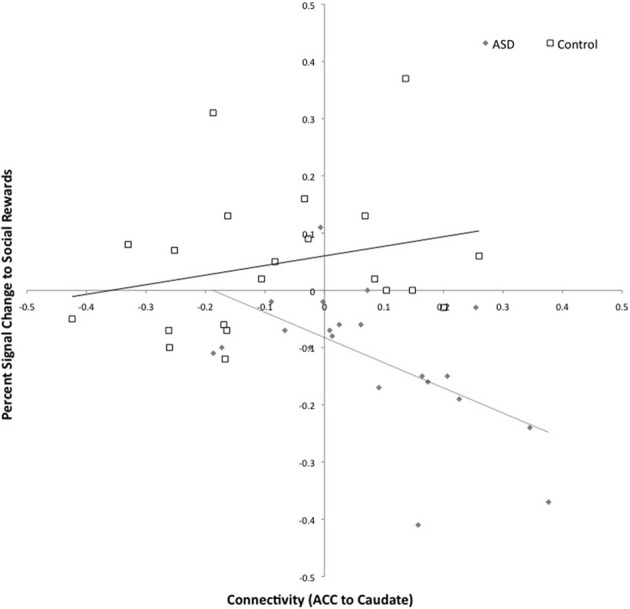
Figure 6.

Connectivity between the left caudate and right anterior cingulate and activation to social rewards in the left caudate. Connectivity values are shown on the x-axis and percent signal change for social reward feedback is shown on the y-axis. The ASD group is shown in gray (with dashed trend-line) and the controls in white (with solid black trend-line).
