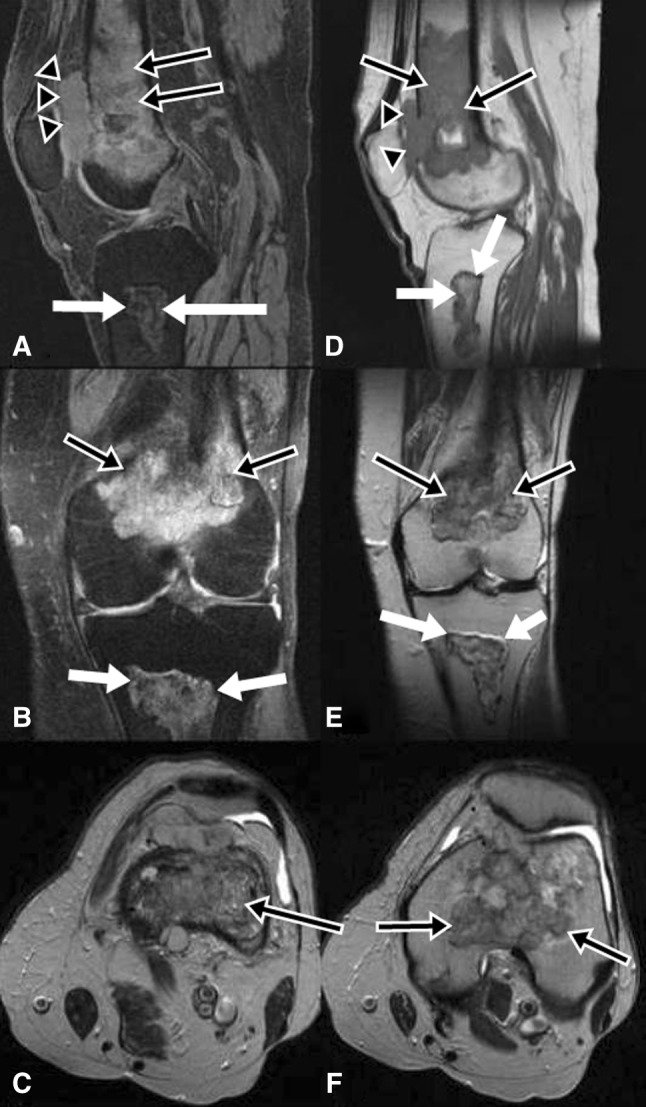
Fig. 2A–F.

(A) Sagittal T2-weighted with fat saturation, (B) coronal T2-weighted with fat saturation, (C) axial T2-weighted, (D) sagittal T1-weighted, (E) coronal T2-weighted, and (F) axial T2-weighted MR images are shown. An area of ill-defined increased signal intensity is seen on the T2-weighted images and decreased signal on the T1-weighted images (black arrows with white margin) in the distal femur. There is an adjacent soft tissue density (arrowheads) that can be seen in Illustrations A and D. There is endosteal scalloping, periosteal reaction, and cortical destruction associated with the soft tissue mass with cortical break-through. An area of well-defined bone infarct is seen in the proximal tibia (white arrows).
