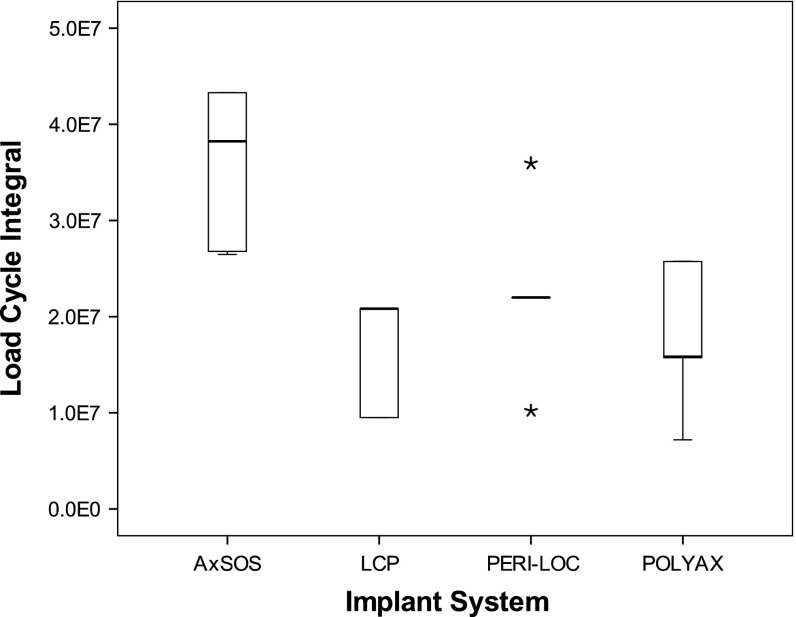
Fig. 6.
Box-and-whisker plot of the load cycle integral of all implant systems. The box shows the interquartile range (IQR) and the whiskers extend to the smallest and largest values except data points with distance greater than 1.5 times IQR. The black line within the box represents the median. Outliers are data points lying between 1.5 times IQR and three times IQR. Extremes are data points beyond three times IQR and were marked as asterisks (*). All data points were included for statistical analysis. We found differences between all systems except for PERI-LOC and POLYAX and for LCP and POLYAX.

