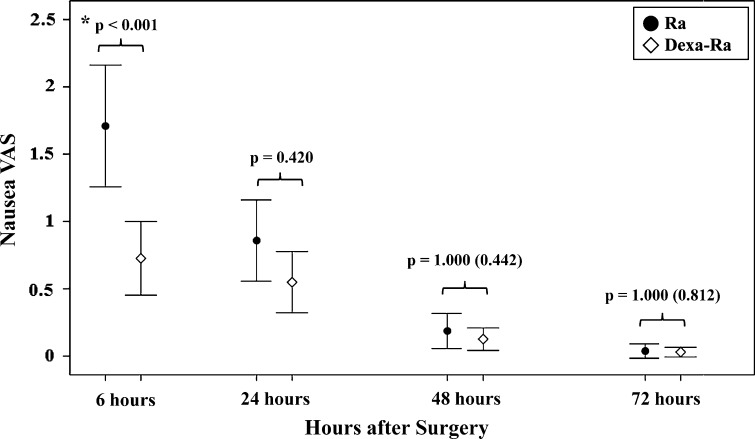
Fig. 2.
A graph shows nausea severity according to VAS scores during the 72 hours after surgery. Patients in the Dexa-Ra group experienced less severe nausea than those in the Ra group during the first 6 hours after surgery. Error bars represent 95% CIs. *p < 0.05; p values in parentheses are uncorrected values before the Bonferroni analysis.

