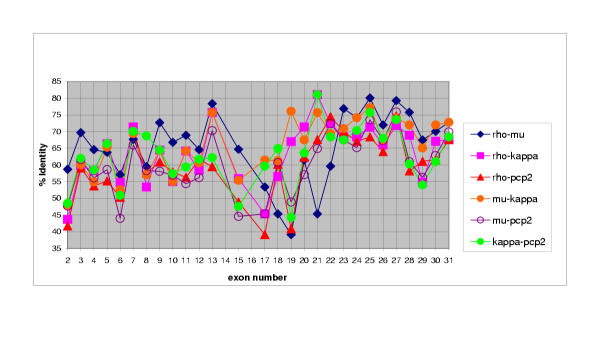
Figure 7.
Pairwise percentage nucleotide identity of individual exons. Exons 2–31 of the four murine R2B genes were compared in a pairwise fashion. Exon numbers are listed on the x axis, and the corresponding percentage identity for that exon is shown on the y axis. Three distinct regions may be discerned: The extracellular (exons 2–13), juxtamembrane (exons 14–18) and phosphatase (exons 19–32) domains.

