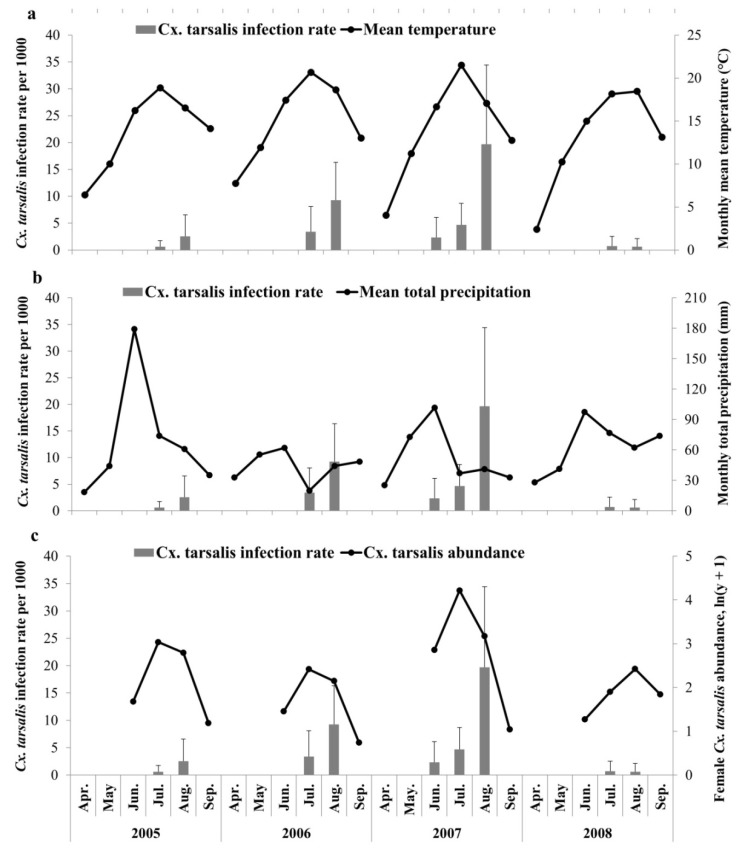
Figure 2.
Temporal trends of (a) Monthly mean temperature (unit 1°C). (b) Monthly total precipitation (unit 1 mm). (c) Monthly mean abundance of Cx. tarsalis, ln(y+1) transformed, compared to monthly mean WNV infection rate in female Cx. tarsalis in the Canadian prairies. Error bar indicates the standard deviation of mean Cx. tarsalis infection rate.

