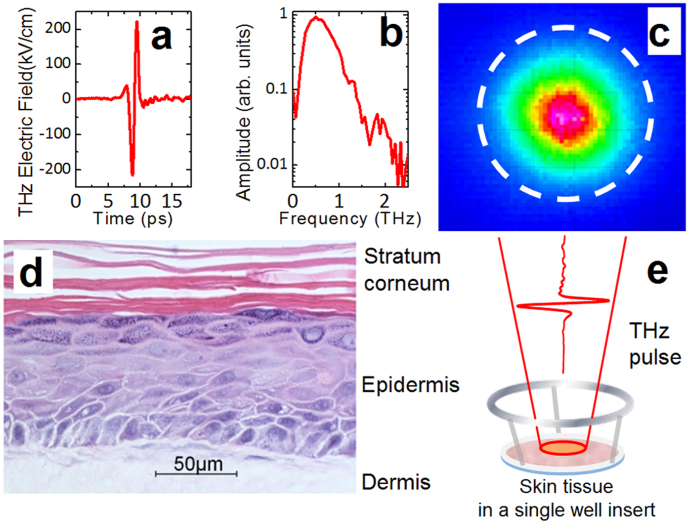
Figure 1. Intense THz pulses and skin tissue samples used in this study.
(a) Electric field wave form of the THz pulse. (b) Spectral bandwidth of the THz pulse shown in (a). (c) THz spot profile at the focus. The 1/e2 diameter of the THz beam is 1.5 mm. The 2 mm-diameter dashed circle shows the portion of the tissue that was excised for gene profiling. (d) Histology of an EpiDermFT tissue section (400X image, courtesy of MatTek). (e) Schematic illustration of the THz exposure procedure. The EpiDermFT tissue is in a single well insert placed at the focus of THz beam.

