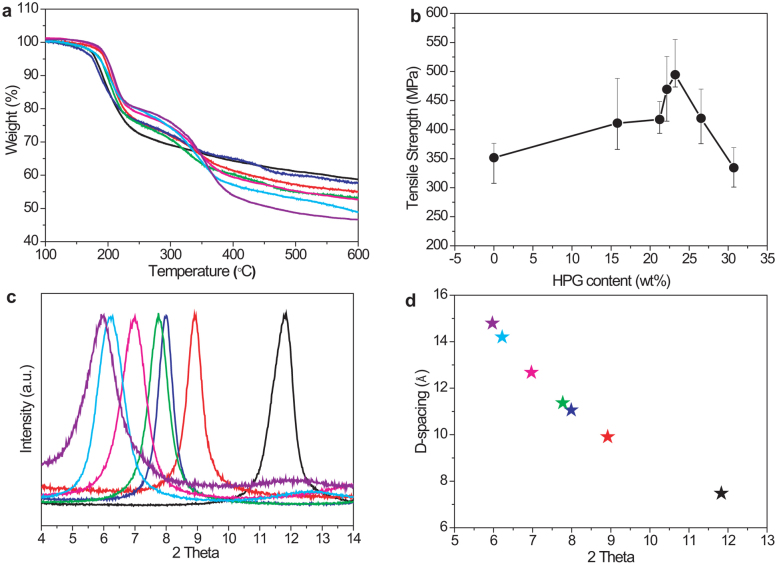
Figure 5. Controlled structure of GGO-HPG composites.
(a) TGA curves of neat GGO (black line) and GGO-HPG composites with different HPG fractions. (b) The σ of GGO-HPG composites as a function of HPG contents. (c) XRD patterns of neat GGO (black line) and GGO-HPG composites with different HPG contents. (d) The interlayer d-space of GGO-HPG composites as a function of 2 Theta. Error bars in b represent the minimum and maximum values obtained from eight independent experiments.

