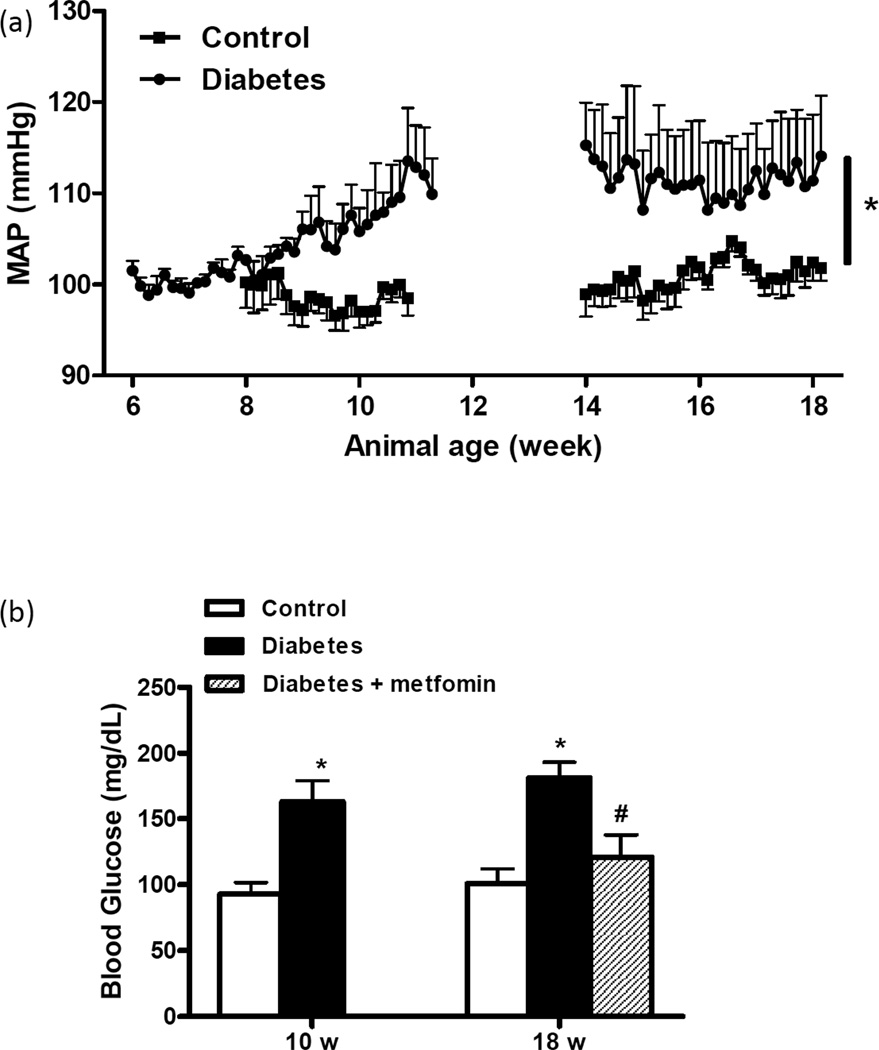
Figure 1.
(a) Mean arterial blood pressure (MAP) was monitored by telemetry in two sets of control and diabetic animals between the ages 6–12 and 14–18 weeks. (b) Blood glucose levels were measured in control and diabetic GK rats weekly starting at 6 weeks and average glucose level over the study period is reported. Mean ± SEM, n=5 for MAP and n=7–14 for blood glucose measurements, *p<0.05 vs control, p<0.05 vs 18-w diabetes.

