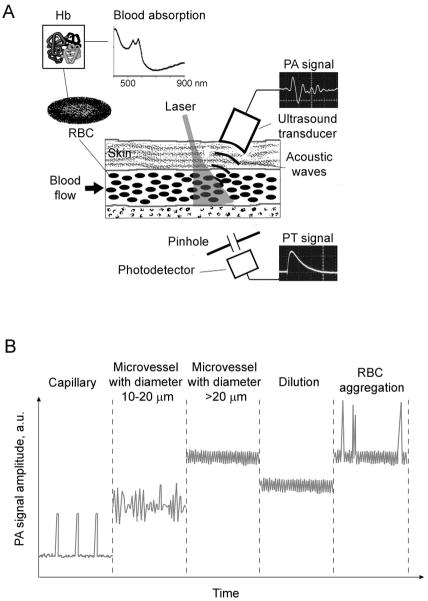
Figure 1.
The principles of in vivo PA and PT blood rheology tests. (A) Schematics. The insets on right shows PA signal (top) and PT signal (bottom) after one laser pulse. (B) Phenomenological model: PA signal trace dynamics in different vessels after averaging many signals generated by a high pulse rate laser.

