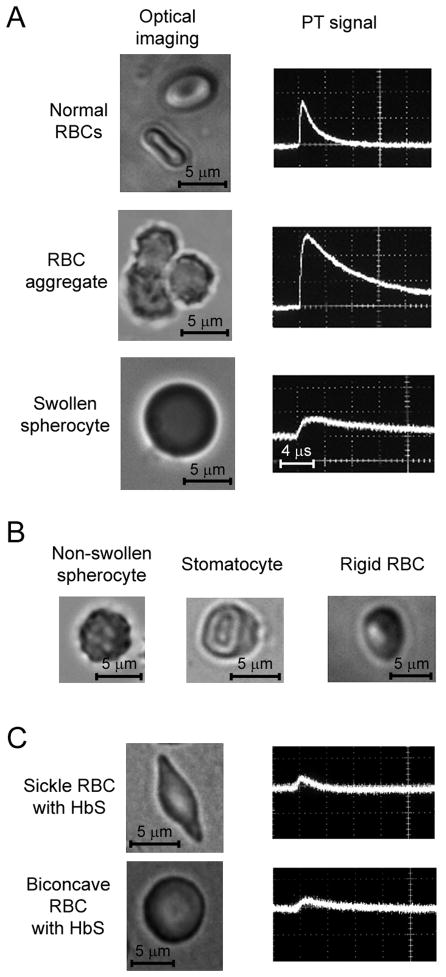
Figure 2.
Ex vivo rheology tests using optical and PT techniques. (A) High-resolution (×100) optical images (left column) and pulsed PT signals (right column) from single normal RBC, RBC aggregates consisting of three RBCs, and low-deformable swollen spherocyte. (B) Typical pathological types of low-deformable RBCs. (C) High-resolution (×100) optical images (left column) and PT signals (right column) from sickle (top) and round (bottom) RBCs with HbS.

