Figure 3.
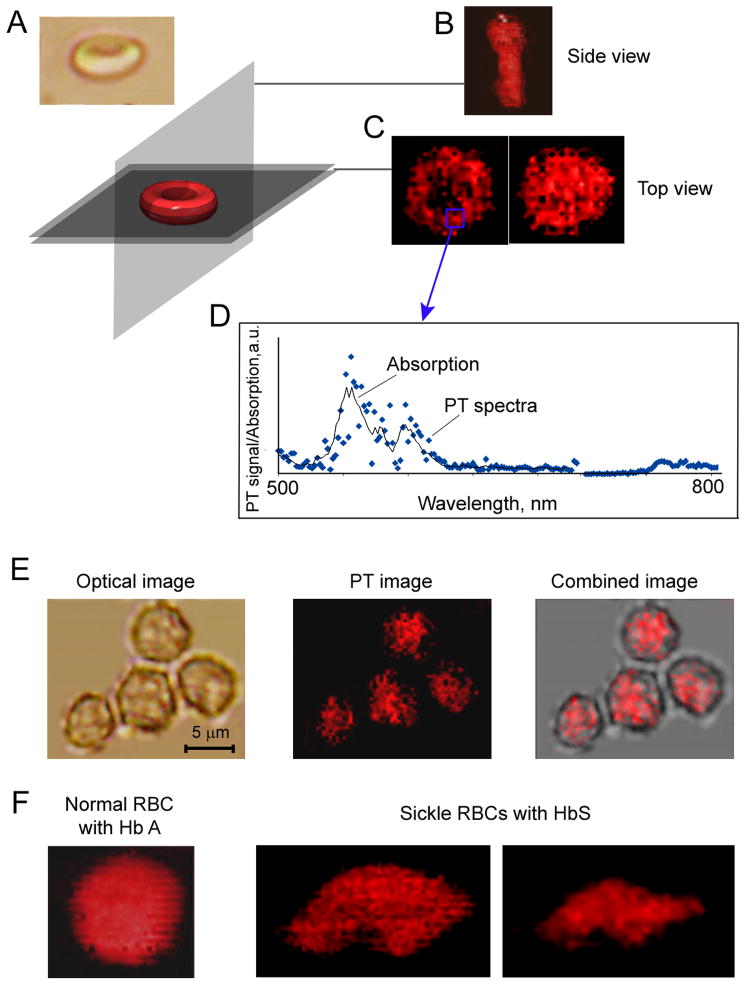
High-resolution PT imaging of Hb in live RBCs. (A) Direction of spatial PT scanning of RBCs. (B) PT image of biconcave RBCs (A, top) obtained with the vertical scanning; (C) PT image of RBCs with a ring or round shape obtained with horizontal scanning. (D) Spectral identification of Hb based on correlation of PT spectra (blue points) from the indicated area on the RBC image with the absorption spectrum of Hb (solid black line). (E) Distribution of Hb in nonswollen spherocytes. (F) Comparison of the heterogeneity in PT images of intact (left) and sickle (middle and right) RBCs.

