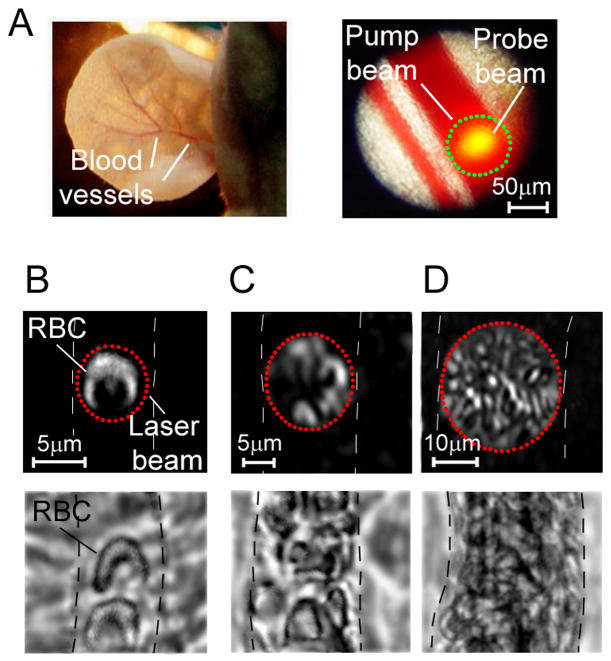
Figure 4.
PT multiplex thermal lens imaging of blood flow. (A) Optical images of animal model: mouse ear. (B) Single RBC in small capillary; magnification 60×. (C) Several RBCs in large capillary, magnification 20×. (D) Multi file RBC flow in microvessels; magnification 10×. Dash lines show the boundary of blood vessels. Top row: PT images of ear blood vessels; bottom row: optical images of mesentery blood vessel.

