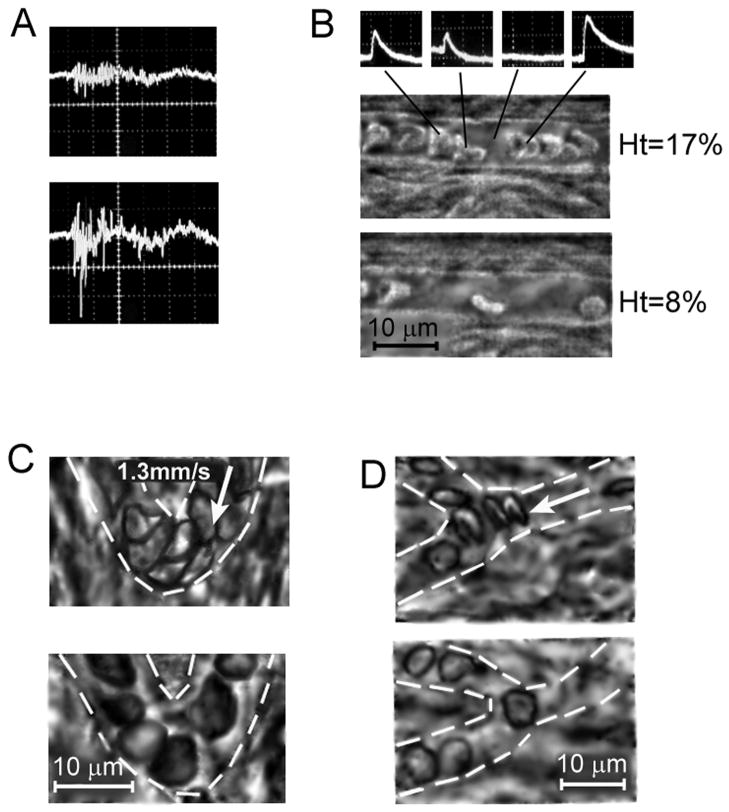
Figure 5.
Integration of PT flow cytometry and high speed (1,000–5,000 fpame per second) high resolution transmission imaging of circulating blood in vivo. (A) Dynamic PT signals from blood flow before (top) and after (bottom) formation of circulating RBC aggregates. (B) PT signals (top) from the individual RBCs (middle, bottom)) moving with velocity ~1 mm/sec in small mesenteric vessel with diameter of 10 μm (used for estimation of Ht). Optical monitoring of alterations of RBC deformability under chemical impacts of Diamide (C) and Chlorpromazine (D).

