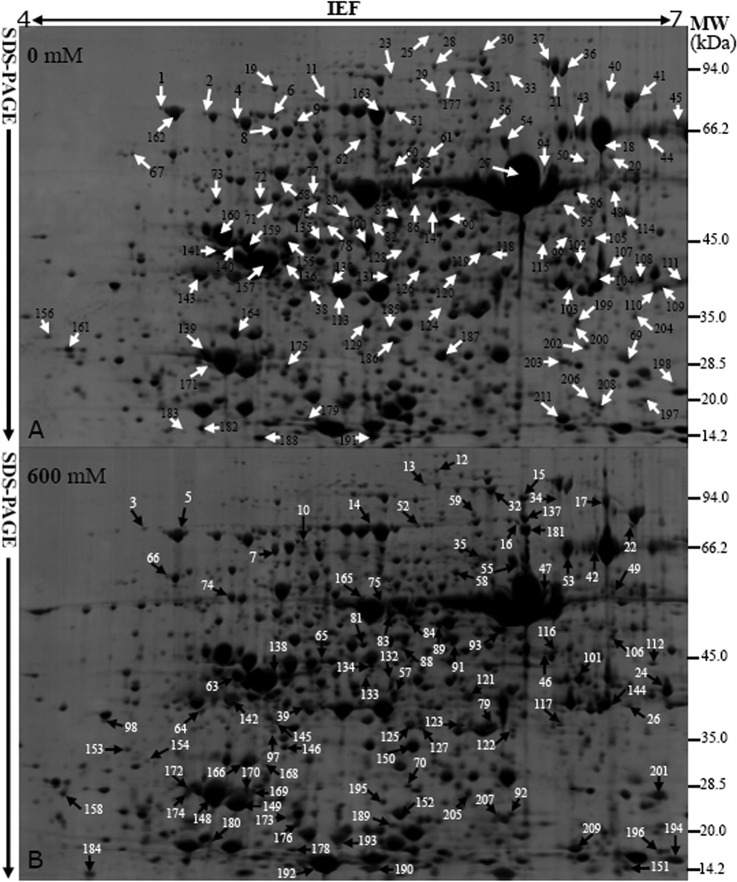
Fig. 4.
Typical 2-DE profiles of proteins extracted from Thellungiella leaves treated with different concentrations of NaCl. Total proteins were separated via 2-DE and stained with GAP. The 2-DE protein profiles of samples from leaves treated with 0, 200, 400, and 600 mm NaCl for 15 days are presented (supplemental Data S2), and the identified differentially expressed proteins are marked with numbers on the 2-DE gels of the 0 (A) and 600 (B) mm NaCl treated plants. The molecular weight (Mr) in kilodaltons and pI of proteins are indicated on the right and top of gel A, respectively. About 1000 μg proteins were loaded per pH 4–7 gel. Arrows indicate the 209 positively identified different proteins.

