
Fig. 5.
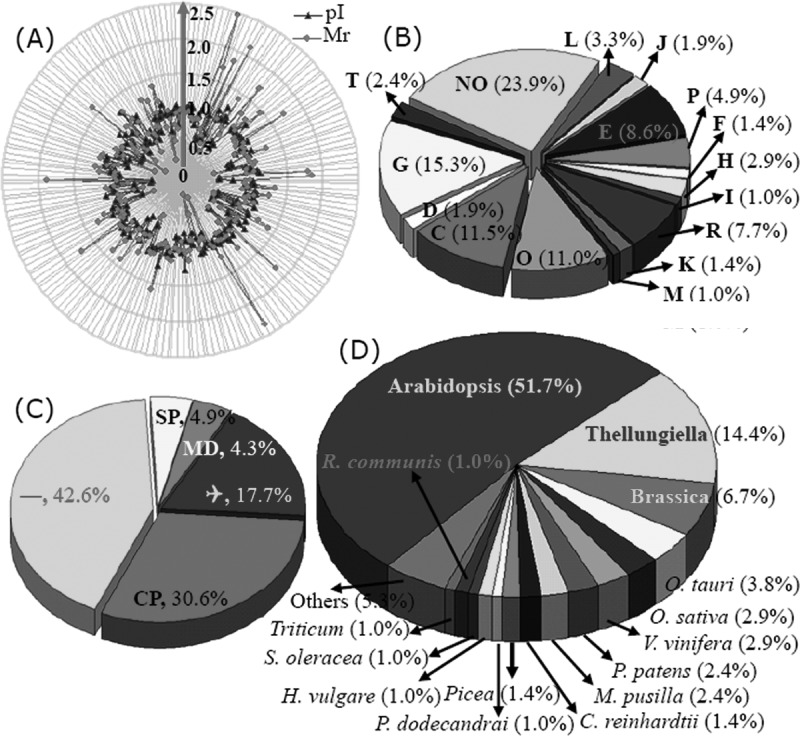
Classification and functional analysis of the 209 identified differentially expressed proteins. To evaluate the quality of identified proteins, the theoretical and experimental ratios of Mr and pI were presented in radial charts as radial and annular radar axis labels, respectively (A). Then, each of the identified proteins was functionally classified following COG (B). The proportion of each functional category was the sum of the proportion of all identities. The subcellular locations of the 209 identified proteins were obtained via TargetP (C). Of them, 30.6% were predicted to localize in chloroplast (CP), 4.9% in the secretory pathway, and 4.3% in mitochondria (MP); 17.7% were unknown proteins (Q). The largest part, including 89 proteins, was designated as “any other location.” The distributions of the identified proteins in different plant species also are presented (D).