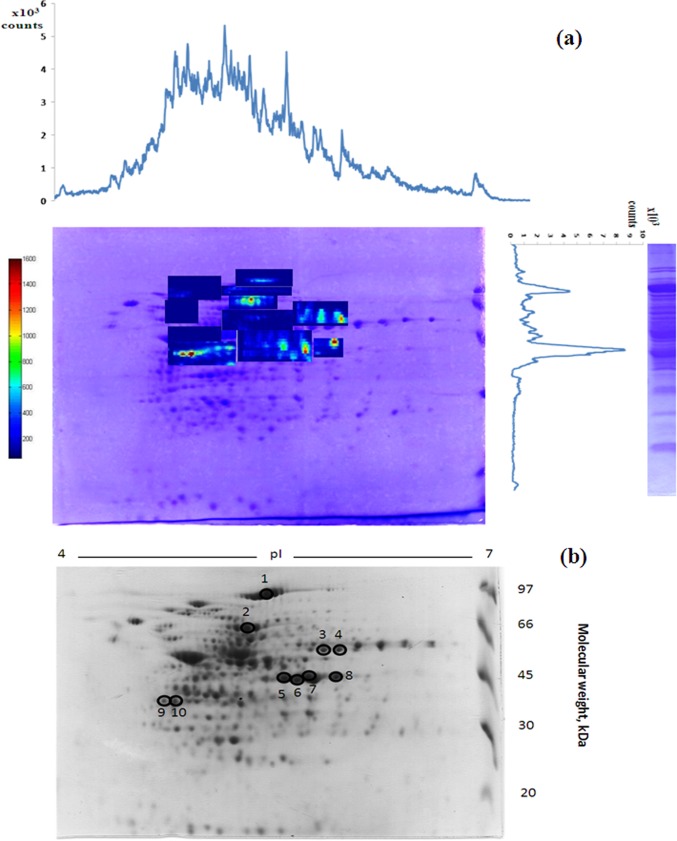
Fig. 2.
A, Imaging of Se-containing protein spots in a 2D SDS-PAGE gel of a L. reuteri Lb2 BM soluble extract by Laser Ablation ICP MS. The to be imaged areas were defined on the basis of 1D (IEF or SDS) LA - ICP MS electropherograms. B, A parallel 2D SDS-PAGE of L. reuteri Lb2 BM soluble extract prepared for proteomics analysis. Circles and numbers refer to spots which were excised and further analyzed. (cf. Table I).

