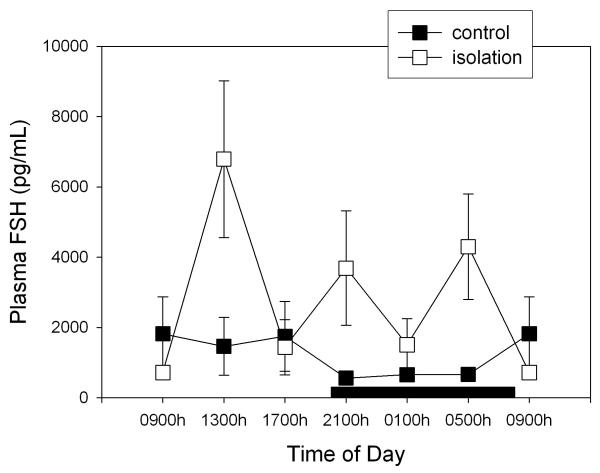
Figure 2.
Effect of isolation on 24-h changes of plasma FSH concentration in young male rats. Groups of 6–8 rats were killed by decapitation at 6 different time intervals throughout a 24 h cycle. Values at 0900 point are repeated on the "second" day. Bar indicates scotophase duration. Shown are the means ± SEM. For further statistical analysis, see text.

