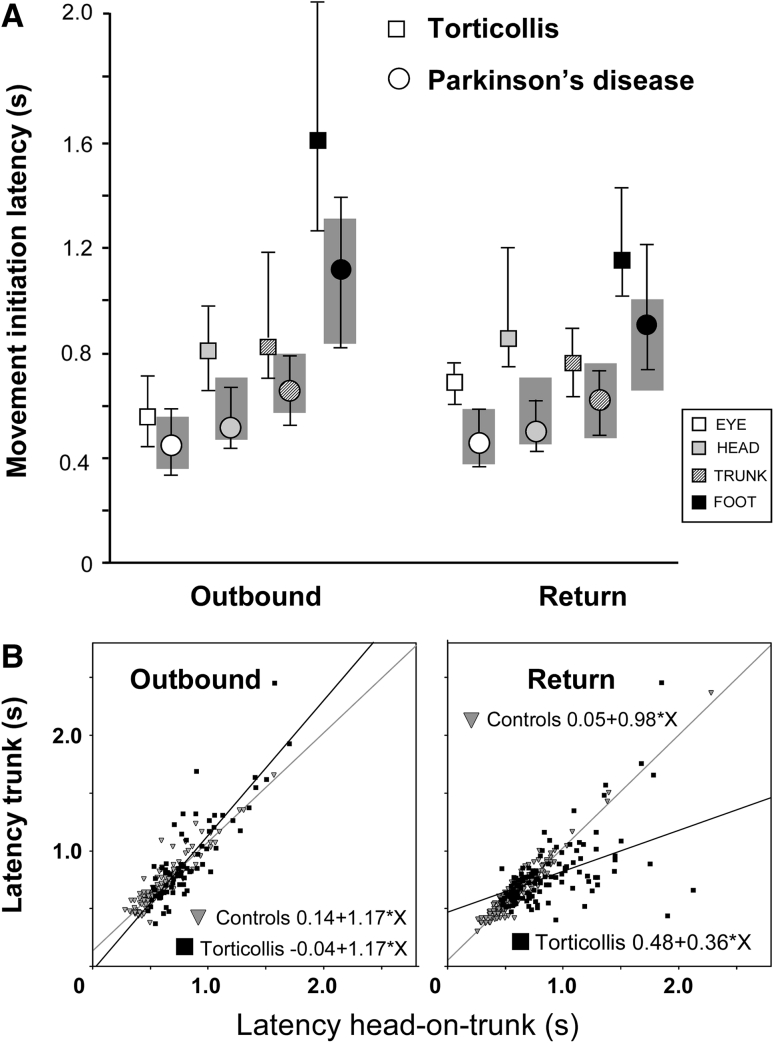
Fig. 2.
Movement initiation times (latencies). a Normal values are given by the shaded areas (75–25 interquartile range) while torticollis patients median and interquartiles ranges are represented by quadrangles and error bars respectively (for comparison data from Parkinson’s disease patients taken from Anastasopoulos et al. [22] are represented as circles). Note that during inbound (return) trials eye and head latencies in the torticollis patients are further delayed with respect to normal than during outbound trials. In contrast, trunk and foot latencies tend to normalise during inbound trials. b Plots of latency of head-on-trunk versus the latency of trunk movement initiation (straight lines best linear regression fits). The relationship is linear in control subjects (gray triangles) both for outbound and inbound trials. However, note that the head-trunk coupling is loose in torticollis patients (filled quadrangles) particularly during predictable (inbound) trials as reflected in the low R 2 value. Here, in many instances the trunk preceded the head

