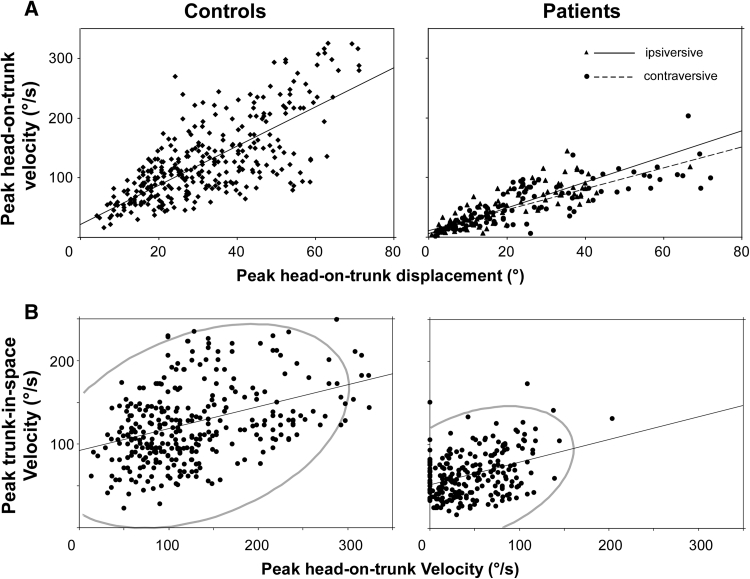
Fig. 4.
Peak head-on-trunk velocity as a function of head-on-trunk displacement amplitude and peak trunk-in-space velocity. a Patient data separately for ipsiversive and contraversive turns with respect to the direction of torticollis. b Plots of patient (right diagram) and control data (left). The area covered by the density ellipse including 95 % of data points is 2.81 times smaller in patients

