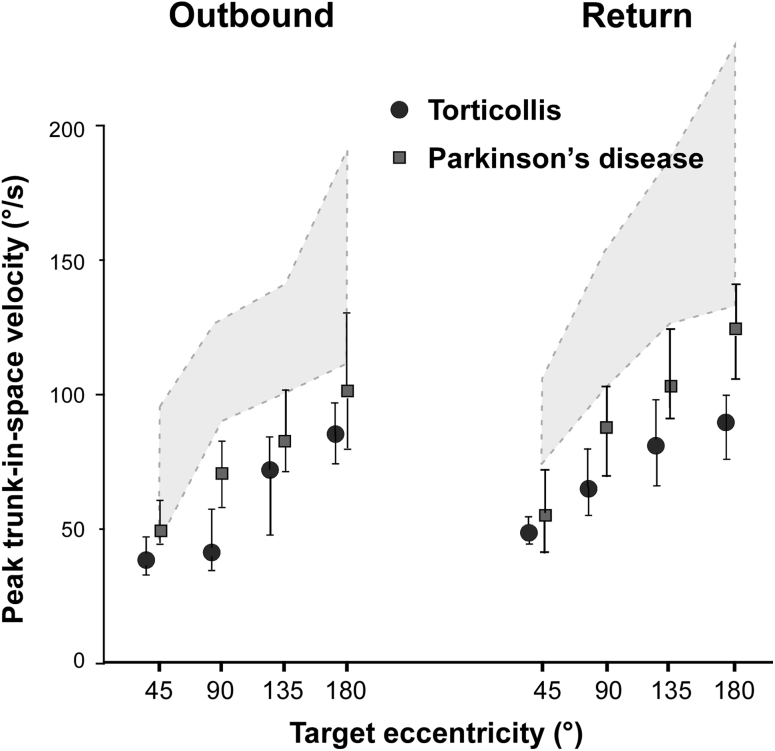
Fig. 5.
Peak trunk velocity as a function of target eccentricity. Filled circles represent median values and error bars upper and lower quartiles in patients; shaded area represents interquartile range in controls. For comparison data from parkinsonian patients investigated with the same methodology were added (filled quadrangles). Note that the trunk moved slower in torticollis than in mildly to moderately affected Parkinson’s disease patients

