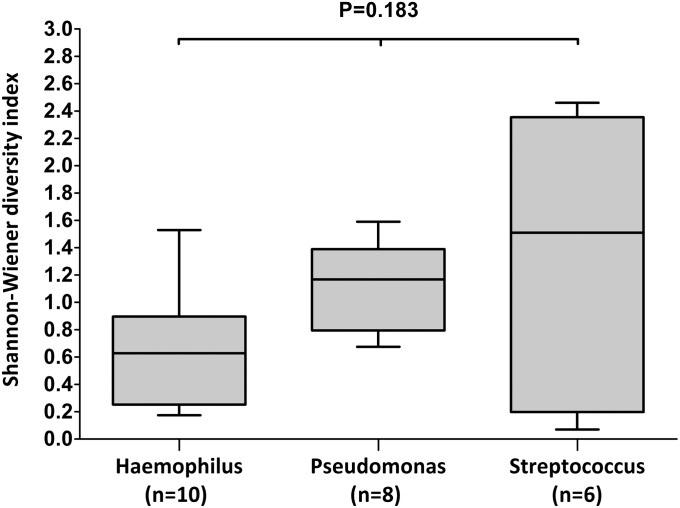
Figure 6.
Box plot comparison of microbial diversity (Shannon-Wiener diversity index) in samples dominated by the genera Haemophilus (n = 10), Pseudomonas (n = 8), and Streptococcus (n = 6), where higher values correspond to higher diversity. The top and bottom boundaries of each box indicate 75th and 25th quartile values, respectively, with the black line inside each box representing the median (50th quartile). The ends of the whiskers indicate the range. There was no significant difference in diversity between the three groups (median Shannon-Wiener diversity index [interquartile range]: Haemophilus, 0.63 [0.25, 0.90]; Pseudomonas, 1.17 [0.79, 1.40]; Streptococcus, 1.51 [0.19, 2.35]; P = 0.183, Kruskal-Wallis test).

