Fig. 1.
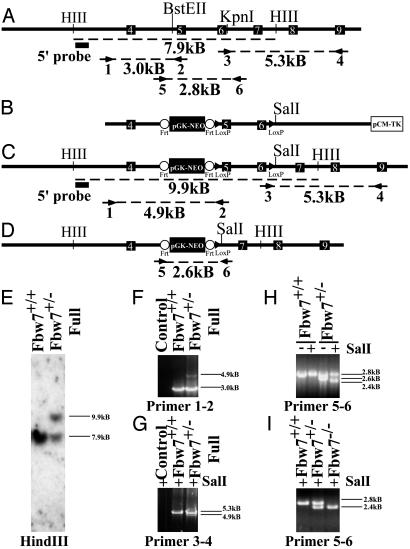
Targeted disruption of the mouse Fbw7 locus. (A) Restriction map of the Fbw7 genomic locus, showing intron–exon boundaries and location for exons 4–9 (indicated by white numbered black boxes) of mouse Fbw7. Primer pairs (arrows) used for PCR analysis are indicated numerically beneath the primer, and the size of the predicted product is indicated beneath dashed line. The probe used for Southern hybridization is indicated by a filled black box. (B) Map of targeting construct. Frt sites are indicated by open circles, and loxP sites are indicated by filled triangles. (C) The restriction map of the Fbw7 locus after homologous integration of the construct in B. Predicted PCR fragment sizes are shown. (D) The restriction map of the Fbw7 locus after Cre-mediated recombination. (E) Southern hybridization using the probe indicated by the filled black box in A and C after HindIII digestion of ES cell DNA. (F) PCR analysis of the 5′ end of the targeted Fbw7 locus by using primer pair 1–2 shows single homologous integration of frt-NEO-frt-loxP cassette into ES cells. (G) PCR analysis of the 3′ end of the targeted locus in ES cells by using primer pair 3–4 confirming the presence of the distal loxP site, indicated by the presence of a unique SalI restriction site engineered into the loxP site. (H) PCR genotyping of ES cells using primers 56 following Cre-mediated recombination, compared with wild-type cell line. (I) PCR genotyping of embryos from yolk sac DNA with primer pair 5–6. The “full” designation describes the Fbw7 mutant allele shown in C before Cre recombination whereas a minus sign alone denotes that allele after Cre-mediated recombination (D).

