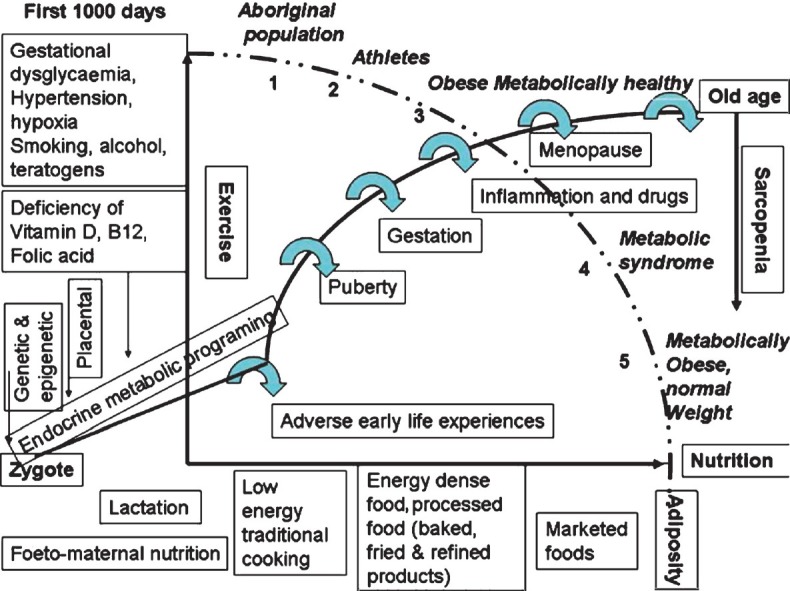
Fig.

Body response to obesogenic environment across the life cycle. The dark line connecting the zygote to old-age represents the endocrine metabolic programming. The X axis represents the various sources of nutrition. Exercise the major modulator of response after the first 1000 days is represented in the Y axis. The six major factors favouring sarcopenia (less skeletal muscle) are depicted by broad curved arrows. The five major outcomes are labelled along the dotted line with bold italic letters. Adverse early life programming manifests as metabolically obese normal weight individuals (5).
