
Fig. 1.
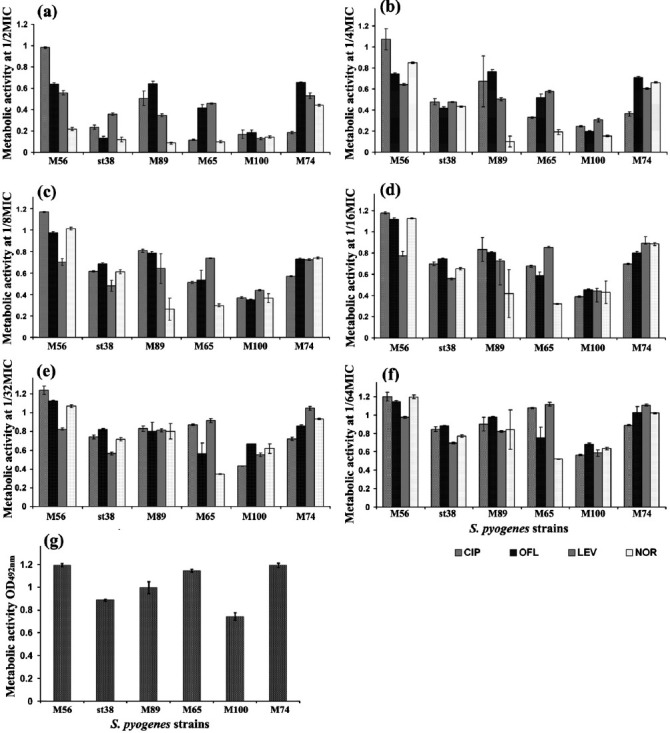
Metabolic activity of biofilms formed by S. pyogenes isolates at their subinhibitory concentrations (a) 1/2MIC, (b) 1/4MIC, (c) 1/8MIC, (d) 1/16MIC, (e) 1/32MIC, (f) 1/64MIC and (g) Control as quantified by XTT assay and measuring A492nm. Mean value of triplicate independent experiments and SDs are shown. Dunnett's test demonstrated significant difference between the tests and the control (P< 0.05).