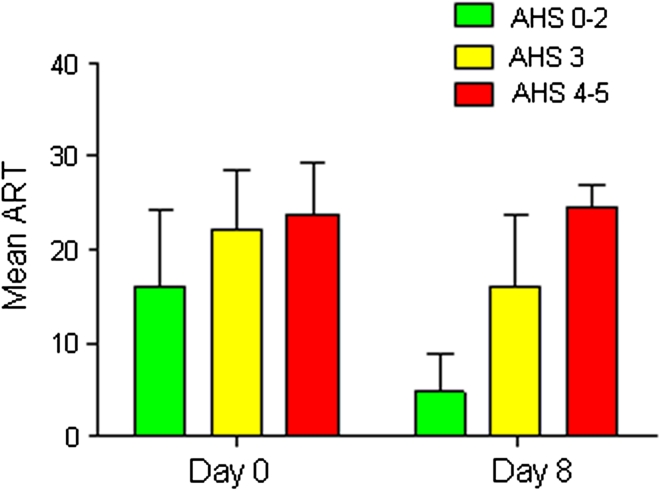
Fig. 2.
D0 and D8 ART in patients with good, intermediate and poor 3-month language outcomes. In green, ART values (mean ± SD) at Day 0 and Day 8 in patients with good outcome (n = 33, 47 % of patients). In yellow, ART values in patients with intermediate outcome (n = 22, 31 % of patients). In red, ART values in patients with poor outcome (n = 15, 21 % of patients). A two-way ANOVA shows that group and time effects and the group X time interaction were significant (p < 0.0001)

