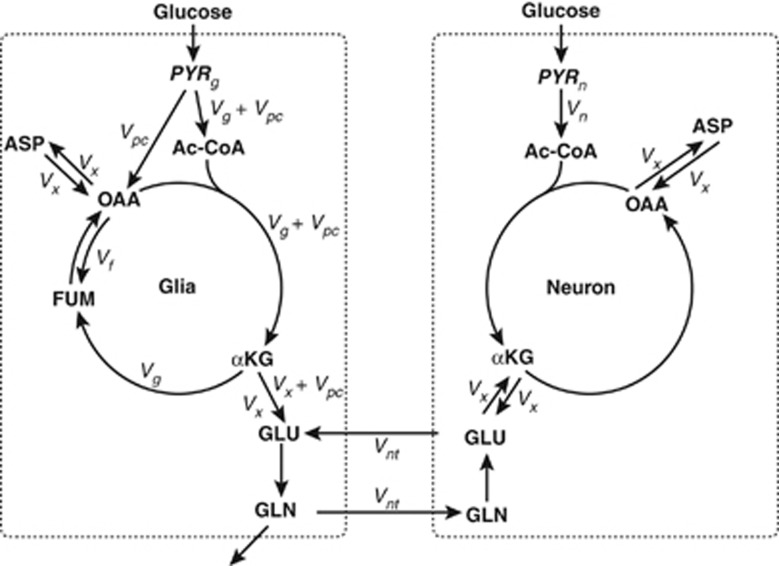
Figure 1.
Schematic diagram of the proposed model. The two compartments represent neuronal and glial metabolism of pyruvate precursors. The major metabolic pathways in both brain cells are displayed: from glucogenic precursors (mostly blood-borne glucose) to pyruvate through glycolysis, the anaplerotic pathway via pyruvate carboxylase in the glial compartment, neuronal, and glial tricarboxylic acid cycle (TCA) cycle, the glutamate–glutamine cycle, and glutamate-α–ketoglutarate and oxaloacetate–aspartate exchange. Variables estimated from the nuclear magnetic resonance (NMR) data using the model include: α-KG, α-ketoglutarate; ASP, aspartate; FUM, fumarate; GLN, glutamine; GLU, glutamate; OAA, oxaloacetate; PYRg, pyruvate enrichment in glia; PYRn, pyruvate enrichment in neurons; Vg, glial tricarboxylic acid cycle rate; Vn, neuronal tricarboxylic acid cycle rate; Vnt, neurotransmitter exchange rate; Vpc, pyruvate carboxylase rate, which also represents the rate of loss of carbon from the system (bottom of left-hand side of figure); Vx, glutamate-α–ketoglutarate and oxaloacetate–aspartate exchange rate; ‘Vf', exchange rate between oxaloacetate and fumarate.

