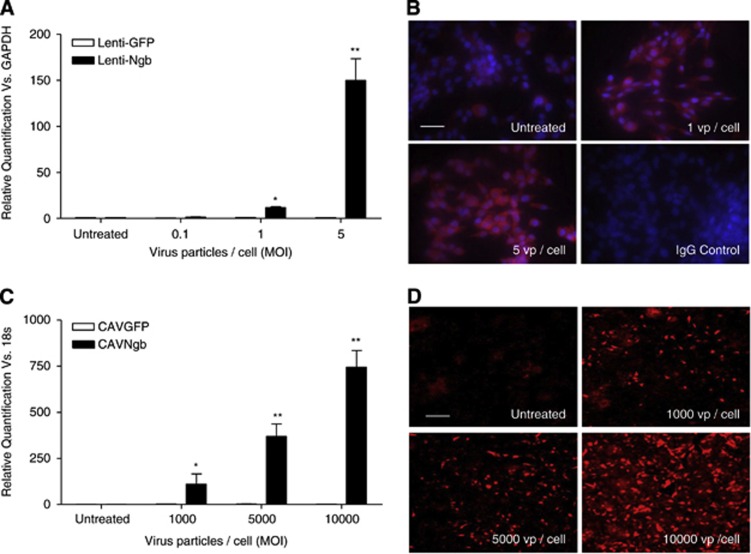
Figure 1.
Confirmation of neuroglobin (Ngb) overexpression from viral vectors. Functional overexpression of Ngb was assessed by TaqMan quantitative real-time PCR (qRT-PCR; mRNA) and immunocytochemistry (ICC; protein) in B50 neuronal (lenti-Ngb) or HepG2 (CAVNgb) cells 3 days after transduction. (A, C) The Ngb mRNA levels were normalized to glyceraldehyde 3-phosphate dehydrogenase (GAPDH; B50 cells, lenti-Ngb) or 18S (HepG2 cells, CAVNgb) after viral transduction. Relative quantification (RQ) was calculated from ΔΔCt (cycle threshold) and compared with green fluorescent protein (GFP)-expressing virus levels. RQ±RQmax/RQmin shown and analyzed by Student's unpaired t-test with Bonferroni's post hoc correction. *P<0.01 and **P<0.001 versus GFP-expressing virus, n=3. (B, D) Representative photomicrographs of Ngb protein expression determined by ICC in cells transduced with Ngb-expressing viruses using an α-Ngb antibody (B: nuclei=blue, 4',6-diamidino-2-phenylindole (DAPI); both: Ngb=red, TRITC). Negative staining in isotype-matched immunoglobulin G (IgG) controls shown for lenti-Ngb; untreated cells represent basal expression levels of neuroglobin expression. MOI, multiplicity of infection; TRITC, tetramethyl rhodamine isothiocyanate; vp/cell, virus particle/cell. Scale bar, 100 μm.

