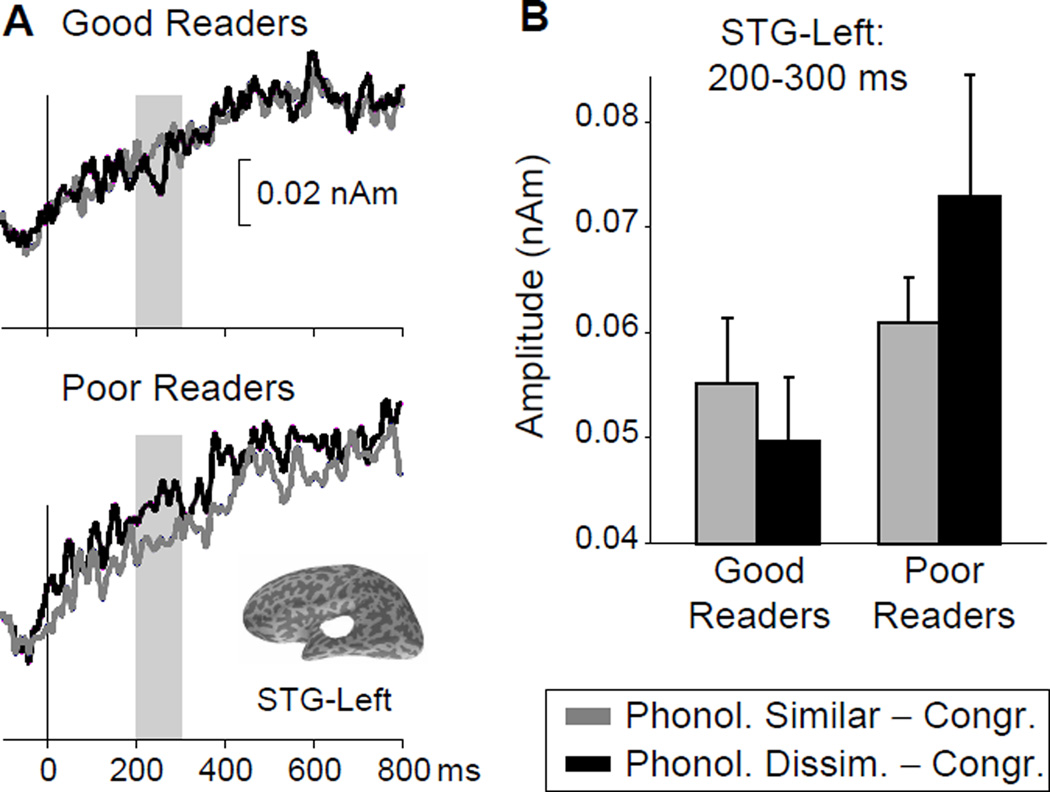
Figure 3.
Region of interest (ROI) analysis of the MEG data. A. MEG source waveforms for the left superior temporal gyrus (STG) ROI, obtained from the minimum-norm estimate (MNE) computed for the Incongruent (either Phonologically Similar or Phonologically Dissimilar) – Congruent conditions and averaged across all subjects in the good (top) and poor (bottom) reader groups. The shading indicates the 200–300 ms time range where a significant interaction effect was found. Time 0 ms corresponds to the onset of the critical final word in a sentence. The location of the left-STG ROI is shown on an inflated cortical surface reconstruction of one subject.
B. Magnitude of the group-averaged MNE activation in the left STG ROI (200–300 ms).

