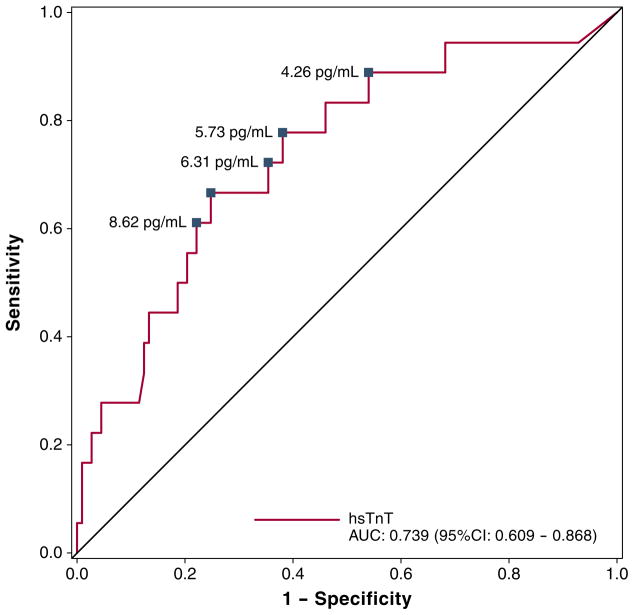
Figure 2. ROC Curve for hsTnT Values for Prediction of Abnormal SPECT-MPI Results.
HsTnT had good discriminatory value for abnormal SPECT-MPI (area under the curve [AUC]: 0.739, 95% confidence interval [CI]: 0.609 to 0.868). The hsTnT cutoffs for sensitivities of 60%, 70%, 80%, and 90% are marked on the receiver-operating characteristic (ROC) curve. Other abbreviations as in Figure 1.

