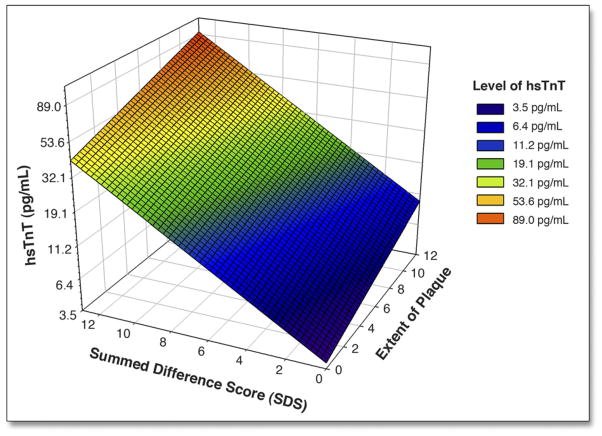
Figure 4. Association of Estimated HsTnT Levels With Reversible Myocardial Ischemia and Coronary Plaque Extent.
The levels of log-transformed high-sensitivity troponin T (hsTnT) were estimated with a linear regression model using the extent of reversible myocardial ischemia (summed difference score [SDS]) and the number of coronary artery segments containing any atherosclerotic plaque as predictors. For better clinical interpretation, the labeling of the y-axis was back-transformed from log-hsTnT levels into hsTnT levels with a unit of picograms/milliliter. Combined information on myocardial ischemia and coronary atherosclerosis explained nearly 20% of the variability in hsTnT (r2 = 0.19), and the 2 variables were independent of each other. The estimated levels of hsTnT are illustrated by different colors as shown in the color key.

