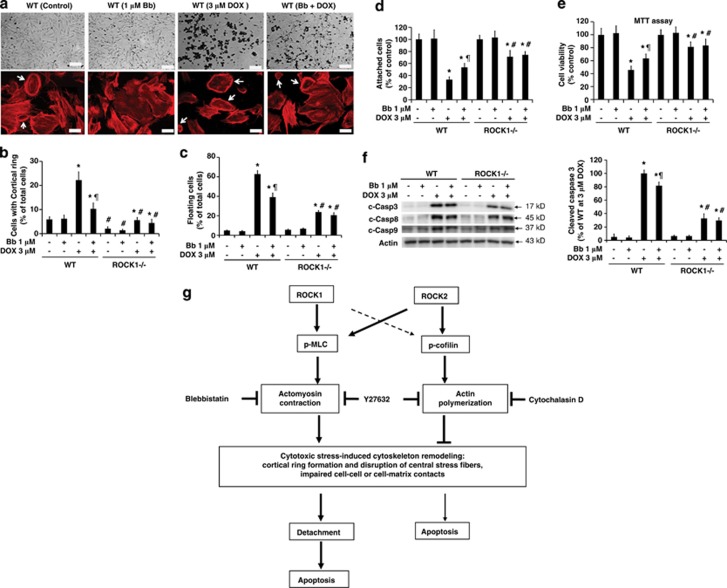
Figure 8.
Inhibition of actomyosin contraction by blebbistatin partially mimics effects of ROCK1 deletion. (a) Representative images of bright field photography (top) and rhodamine-phalloidin staining for F-actin (bottom) of WT and ROCK1−/− cells treated with 3 μM doxorubicin and/or 1 μM blebbistatin for 16 h. Actomyosin contractile rings are indicated with white arrows. Bar, 400 μm (top), 100 μm (bottom). The same treatment condition was use for the following panels (b–f). (b) Cells showing formation of cortical contractile ring structure were counted. (c and d) Floating cells and attached cells were collected and counted. (e) MTT assay was performed. (f) Representative image (left panel) of western blot of cleaved caspase-3, -9, and -8 in cell lysates from attached WT and ROCK1-deficient MEF cells. Densitometry analysis (right panel) of immunoreactive bands of cleaved caspase-3 expressed as percent change relative to WT cells treated with 3 μM doxorubicin. *P<0.05 versus control of the same genotype. #P<0.05 versus WT under the same treatment condition. ¶P<0.05 versus the same genotype under doxorubicin only condition. (g) Schematic summary of roles of ROCK1 and ROCK2 in regulating actin cytoskeleton reorganization induced by cytotoxic stress (e.g., doxorubicin), leading to cell detachment and apoptosis. The thick lines stand for dominating actions. The thin lines stand for minor actions. The broken lines stand for alternative actions in the absence of dominating actions

