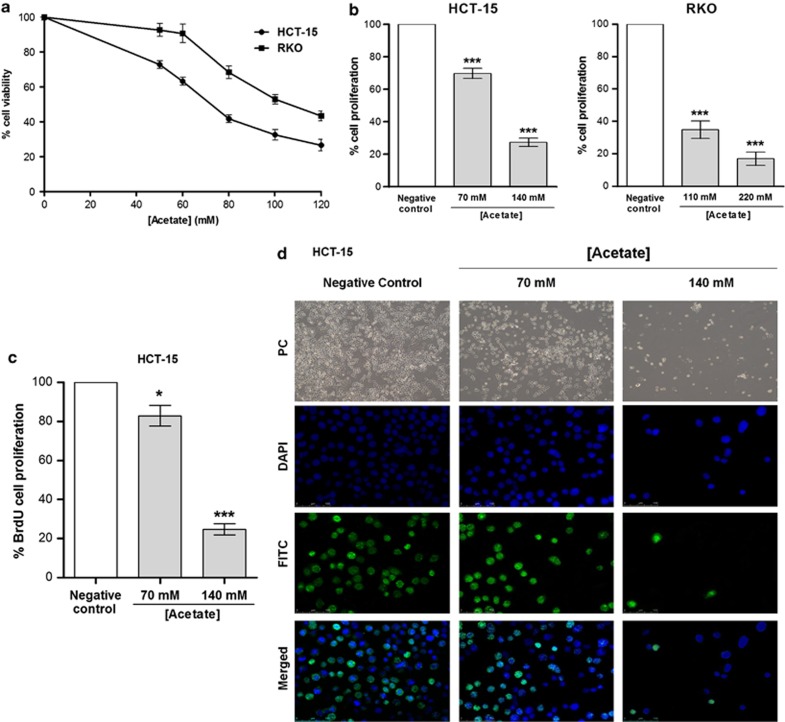
Figure 1.
Determination of acetate IC50 values and proliferation analysis in CRC cell lines treated with acetate. (a) HCT-15 and RKO cells were incubated with different concentrations of acetate for 48 h or with fresh complete medium as a negative control, and IC50 values determined by MTT reduction assay. (b) Cell proliferation analysis by SRB assay in CRC cells treated with acetate. Cells were incubated with IC50 and 2 × IC50 concentrations of acetate (respectively, 70 mM and 140 mM for HCT-15 and 110 mM and 220 mM for RKO) for 48 h. Values represent mean±S.E.M. of at least three independent experiments. ***P≤0.001, compared with negative control cells. (c) Cell proliferation analysis by BrdU incorporation assay in HCT-15 cells treated with acetate (70 mM and 140 mM) for 48 h; values represent mean±S.E.M. of at least three independent experiments *P≤0.05; ***P≤0.001, compared with negative control cells. (d) Representative photographs of BrdU incorporation assay in HCT-15 cells treated with acetate (70 mM and 140 mM) for 48 h. phase contrast (PC; × 100); DAPI (4',6-diamidino-2-phenylindole), FITC (fluorescein isothiocyanate) and merged ( × 200) were obtained by fluorescence microscopy

