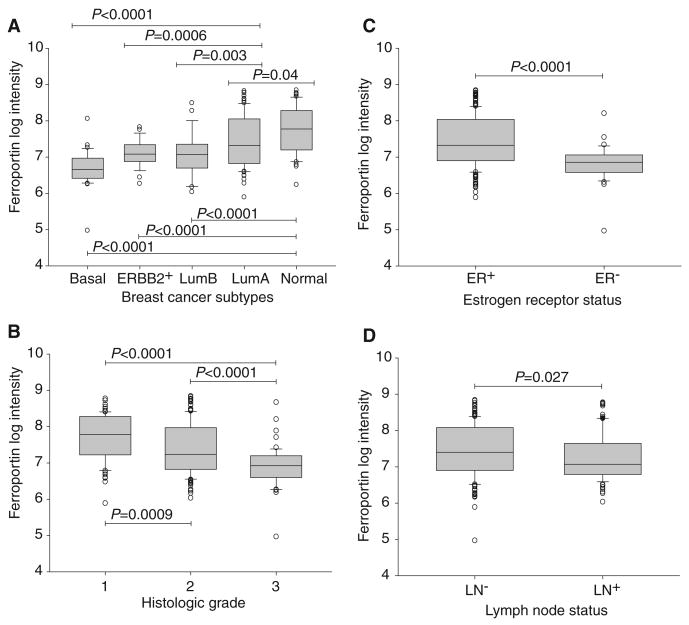
Fig. 4.
Ferroportin expression is correlated with clinical and molecular features of breast cancer. (A) Ferroportin expression in breast cancer molecular subtypes. Shown are box-and-whisker plots of ferroportin gene expression as a function of molecular subtype in consecutive breast cancer patients from Uppsala, Sweden (31). Shaded rectangles represent interquartile range; line in the middle of each rectangle represents median value. Lines extending from the interquartile range mark the 5th and 95th percentile values, and the individual open circles represent values that are either above the 95th percentile or below the 5th percentile for each distribution. P values are shown above bridges linking the subtypes. LumA, luminal A; LumB, luminal B; ERBB2+, ErbB2/HER2/neu-positive–like. (B) Ferroportin expression is correlated with histologic grade. Shown are box-and-whisker plots of ferroportin gene expression as a function of histologic grade (1, 2, 3) in the Uppsala cohort. P values (Student's t test) are shown above bridges linking grade categories. (C) Ferroportin expression is correlated with breast tumor ER status. Shown are box-and-whisker plots of ferroportin gene expression as a function of ER status (+, −) in the Uppsala cohort. P value (Student's t test) is shown above the bridge linking ER categories. (D) Ferroportin expression is correlated with lymph node (LN) status. Shown are box-and-whisker plots of ferroportin gene expression as a function of lymph node status (+, −) in the Uppsala cohort. P value (Student's t test) is shown above the bridge linking grade categories.

