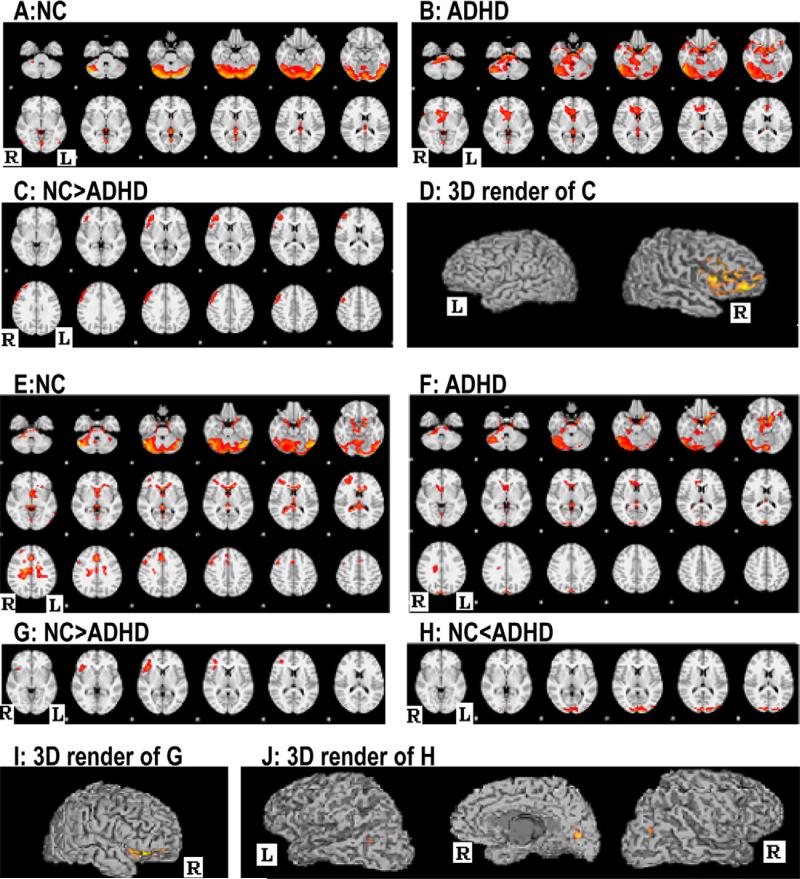
FIGURE 3.
Images A–D show the within-group averages and between-group differences of functional connectivity between the left pulvinar nuclei and the remainder of whole brain, whereas images E–J show those of the right pulvinar nuclei and the reminder of the whole brain in controls and patients. Note: ADHD = Attention-Deficit/Hyperactivity Disorder; L = Left hemisphere; NC = Controls; R = Right hemisphere.

