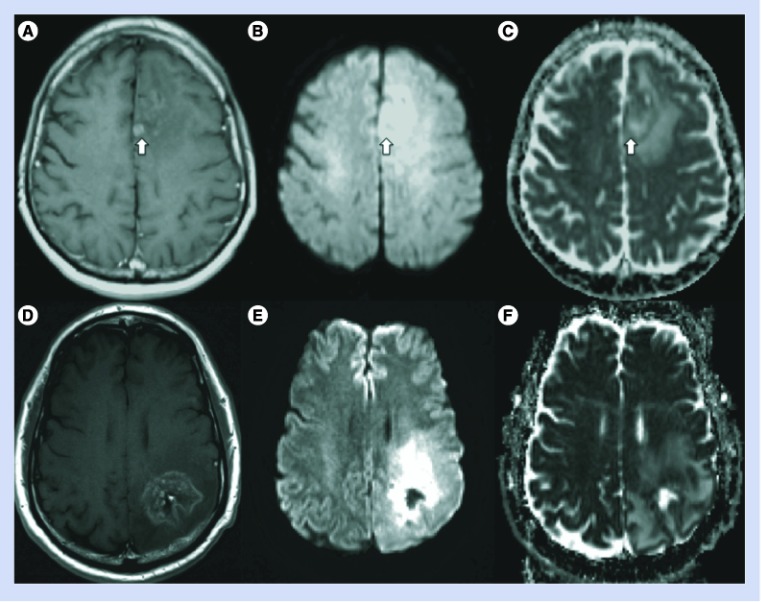
Figure 3. Diffusion-weighted images and apparent diffusion coefficient images for low- and high-grade glioma.
(A & D) Postcontrast T1-weighted images, (B & E) diffusion-weighted images obtained at b = 1000 s/mm2 and (C & F) the corresponding apparent diffusion coefficient maps for patients with (A–C) grade II astrocytoma and (D–F) recurrent glioblastoma, respectively. The bright signal on diffusion-weighted images can result from some combination of restricted diffusion and T2 hyperintensity, the latter of which can occur within edematous tissue, for example. The apparent diffusion coefficient maps eliminate T2 contributions so that restricted diffusion, shown as areas of darker image intensity, can be more clearly delineated. In turn, restricted diffusion may represent areas of increased tumor cell density.

