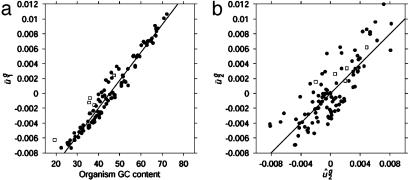
Fig. 2.
(a) Plot of  versus genome GC content for each organism. Usage of the first eigencodon correlates with genome GC content (R2 = 0.961). (b) Plot of
  versus intergenic bias. The second eigencodon correlates with a model constructed as a linear combination of intergenic bias parameters (R2 = 0.669). In both plots, open boxes are data points for A. thaliana, C. elegans, E. cuniculi, P. falciparum, S. cerevisiae, and S. pombe.

