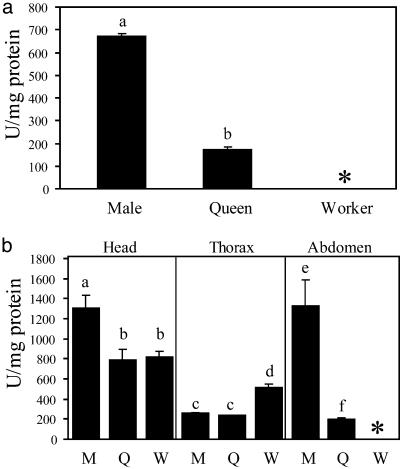
Fig. 3.
SOD1 activity assay levels in activity units per milligram. M, males; Q, mature queens; W, workers; *, not done because of interference by formic acid. Bars in lowercase letters differed significantly after the Bonferroni correction with P < 0.05. (a) In whole bodies, males are higher than queens (t = 22.57, df = 16, P < 0.0001). (b) Male heads have higher SOD1 activity than queen (t = 2.75, df = 15.86, P = 0.01) and worker (t = 3.23, df = 11.24, P = 0.007) heads. Males also show higher activity than queens in the abdomens (t = 4.78, df = 8.13, P = 0.001). For thoraces, male and queen activities are the same but significantly lower than worker activity (male/worker: t = -5.94, df = 10.06, P = 0.001; queen/worker: t = 6.79, df = 8.48, P = 0.0001).

