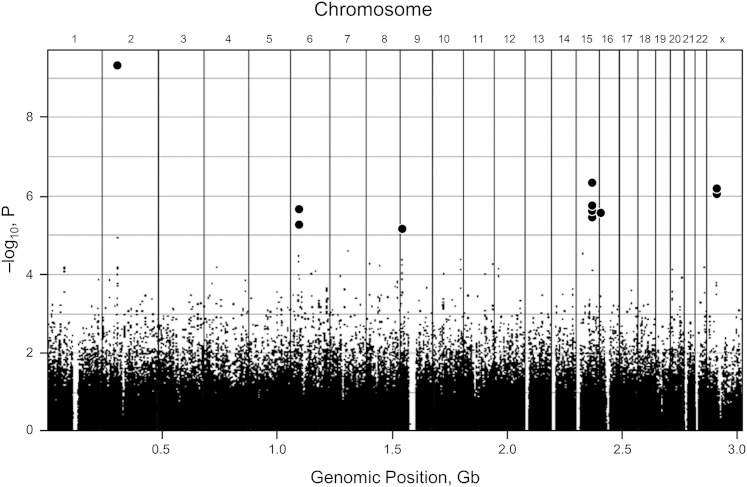
Figure 3.
Genome-wide association study (GWAS) of restless legs syndrome (RLS). A Manhattan plot diagram of a GWAS demonstrating a common method of displaying data from a GWAS. The x axis shows various chromosome locations. The y axis displays the negative logarithm of the association P value. Each dot in the display represents different single nucleotide polymorphisms (SNPs), possibly linked to RLS. The stronger the association, the smaller the P value and the higher the negative logarithm. The higher the dot on the display, the more likely it is that the SNP is statistically different among those with the disease and those without it. In this display, 13 SNPs are significant and highlighted in bold (three SNPs on chromosome 15 are similar and appear as a single dot.) Gb = gigabases. (Adapted with permission from Winkelmann et al.24)

