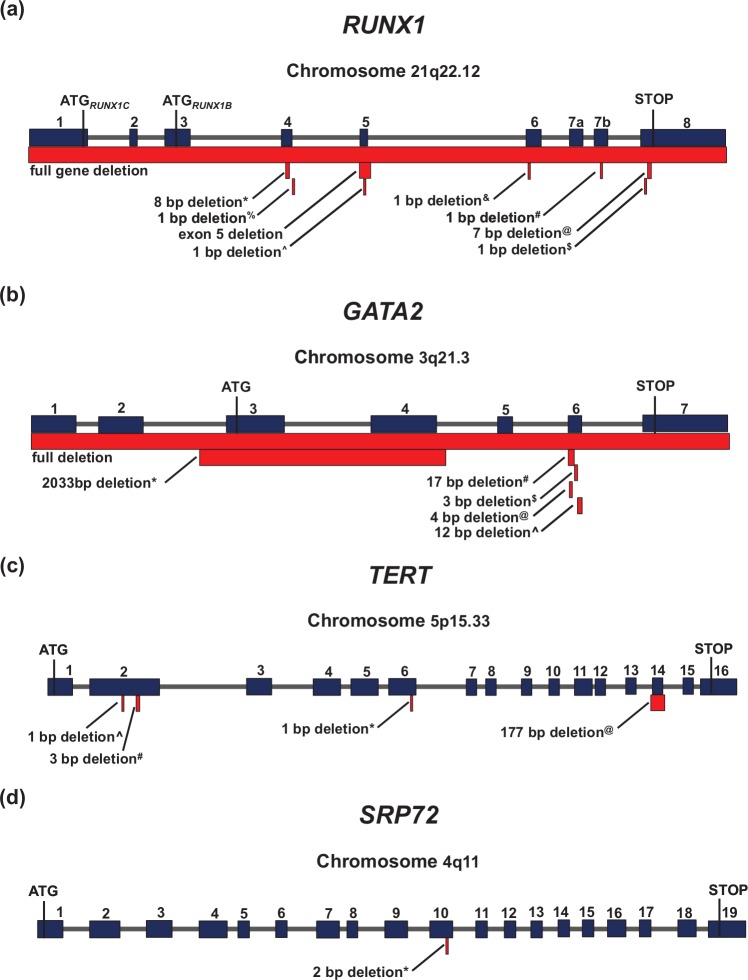
Figure 2.
Detailed schematic diagrams of the deletion mutations that confer familial predisposition to inherited leukemias. The genomic location of each gene is listed under the gene names. Superscripts for each deletion mutation corresponds to that used in Figure 1. (a) Genomic structure of RUNX1 demonstrating locations of disease-causing deletions. ATG1, the first start codon, corresponds to full-length RUNX1 isoform C (NP_001116079.1), and ATG2, the second start codon, corresponds to RUNX1 isoform B (NP_ 001001890.1). (b) Genomic structure of GATA2 demonstrating locations of disease-causing deletions. (c) Genomic structure of TERT demonstrating locations of disease-causing deletions. (d) Genomic structure of SRP72 demonstrating locations of disease-causing deletions. bp, base pair.

