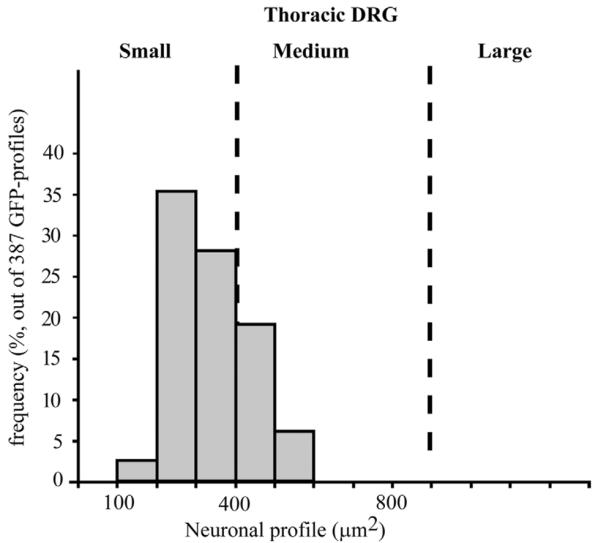
Figure 2.

Graph showing the size distribution of GFP-positive profiles in the thoracic DRG. Note that GFP-positive profiles are most often represented by small-sized profiles. Data are expressed in μm2 and include observations pooled from 387 profiles. These data were corrected using the Abercrombie formula (see Materials and Methods).
